Karnataka 1st PUC Economics Question Bank Chapter 2 Collection of Data
1st PUC Economics Collection of Data TextBook Questions and Answers
I. Choose the correct answer
Question 1.
Which method of collection of data gives better results?
(a) Census
(b) Innovation
(c) Sample survey
(d) Distribution
Answer:
(a) Census
![]()
Question 2.
Which of the following errors is more serious?
(a) Sampling error
(b) Data error
(c) Non-sampling error
(d) Calculation error
Answer:
(c) Non-sampling error
Question 3.
The method of collection of data in which reactions can be watched is
(a) Telephone interview
(b) Personal interview
(c) Mailing questionnaire
(d) E-mail
Answer:
(b) Personal interview
II. Fill in the blanks
Question 1.
Data collected by the investigator is called ……………
Answer:
Primary data
![]()
Question 2.
The method of the interview in obtaining information at a shorter time is…………………..
Answer:
Telephone interview
Question 3.
The most expensive method of interview is……………
Answer:
Personal interview
Question 4.
The method of data collection which cannot be used by illiterates are…………….
Answer:
Mailing questionnaire
Question 5.
Census of India is carried out once in years.
Answer:
Ten
III. Match the following
| A | B |
| 1. Personal interview | (a) Pre-testing of questionnaire |
| 2. Mailing questionnaire | (b) Covers every individual |
| 3, Telephone interview | (c) Loss of questionnaire |
| 4. Pilot survey | (d) Cheaper or relatively low cost |
| 5. Census | (e) More expensive |
Answer:
| A | B |
| 1. Personal interview | (e) More expensive |
| 2. Mailing questionnaire | (c) Loss of questionnaire |
| 3, Telephone interview | (d) Cheaper or relatively low cost |
| 4. Pilot survey | (a) Pre-testing of questionnaire |
| 5. Census | (b) Covers every individual |
![]()
IV. Answer the following in a word or sentence
Question 1.
What is a variable?
Answer:
The values which are subject to change are called variable.
Question 2.
Write the meaning of census.
Answer:
A survey, which includes every element of the population is known as the census.
Question 3.
What is a sample survey?
Answer:
A sample survey is a survey conducted on a group or section of the population from which information is to be obtained.
Question 4.
Give the meaning of sampling error.
Answer:
Sampling error refers to the differences between the sample estimate and the actual value of a characteristic of the population.
![]()
Question 5.
Expand NSSO.
Answer:
National Sample Survey Organisation.
Question 6.
Expand CSO.
Answer:
Central Statistical Organisation.
Question 7.
Expand DGCIS.
Answer:
Directorate General of Commercial Intelligence and Statistics.
V. Answer the following questions in about four sentences
Question 1.
Mention the two sources of data. (S-2018) (N-2018)
Answer:
Primary data and secondary data are the two sources of data,
Question 2.
Write any two qualities of a good questionnaire.
Answer:
(a) Questionnaire should not be too long
(b) Questionnaire should be precise and clear.
![]()
Question 3.
Mention any two-mode or ways of collecting data.
Answer:
The two modes of collecting data are personal interview7 and mailing questionnaires.
Question 4.
Write the differences between census and sample surveys.
Answer:
| Census | Sample Survey |
| It includes even elements of the population. | Here a representative sample is taken for the survey |
| There may not be accurate information. | Provide reasonably reliable and accurate information |
| It is expensive | It is cheap and cost-effective |
| It is time-consuming | It takes less time |
Question 5.
What are the methods of selecting samples in random sampling?
Answer:
The methods of selecting samples in random sampling are:
(a) Lottery method: Under this method, all items of the population are named on separate slips, and folded and placed in a bowl. Then an unbiased person is asked to select a slip. Here, each slip has an equal probability of being drawn.
(b) Use of random number table: Under this method, random selection of the sample can be made by the use of random number tables. A random number table is simply a table of numbers generated by scrambling the digits.
![]()
Question 6.
Give the meaning of the pilot survey
Answer:
Once a questionnaire is ready, it is advisable to conduct a try-out with a small group which is known as a pilot survey or pre-testing of the questionnaire. It gives a preliminary idea about the survey. It helps in pretesting of the questionnaire, so as to know the shortcomings and drawbacks of the questions.
VI. Answer the following questions in about twelve sentence
Question 1.
Does the lottery method always give you a random sample? Explain.
Answer:
It is a well-settled fact that the tire lottery method always gives us a random sample. Random sampling is the one where the individual units from the population (samples) are selected at random.
For instance, the government wants to determine the impact of the price rise in LPG on the household budget of a particular locality. For this, a representative sample of 20 households has to be taken and studied. The names of the 200 households of that area are written on pieces of paper and mixed well, then 20 names to be interviewed are selected one by one.
In random sampling, every individual has an equal chance of being selected and the individuals who are selected are just like the ones who are not selected. In the above example, all the 200 sampling units of the population got an equal chance of being included in the sample of 30 units, and hence the sample, so drawn, is a random sample. So, the lottery method always gives us random samples.
However, the lottery method will not give a random sample in the following cases:
• If the slips are not made of identical size and it is possible to identify the names or numbers on the slips.
• If the same name or number is written on more than one slip or if some name or number is missed out.
![]()
Question 2.
Do samples survey provide better results than census? Give reasons for your answer. (S – 20I8)(Board paper)
Answer:
Yes, a sample survey provides better results than the census.
A sample refers to a group or section of the population from which information is to be obtained. A good sample is generally smaller than the population and is capable of providing reasonably accurate information about the population at a much lower cost and shorter time.
Suppose you want to study the average income of people in a particular state, according to the census method, we need to find out the income of every individual in the region, add them up and divide by a number of individuals to get the average income of people in the state. Tins method would require huge expenditure, as a large number of investigators are to be employed. Alternatively, if a representative sample of few individuals is selected from the state to find their income, it saves time, money, and energy in the process of determination of income.
To sum up, sampling is considered a better method due to following reasons:
- It is more economical than the other techniques of collection of data
- Sample investigation can be done at a greater speed as it consumes less time
- When sampling is conducted scientifically and carefully, it gives accuracy
- Planning, organization, and supervision can be conveniently managed which leads to administrative convenience.
![]()
Question 3.
Briefly explain the sampling errors. (N – 2018)
Answer:
Sampling error refers to the differences between the sample estimate and the actual value of a characteristic of the population. It is the error that occurs when you make an observation from the samples taken from the population.
Thus, the difference between the actual value of a parameter of the population and its estimate is the sampling error. It is possible to reduce the magnitude of sampling error by taking a larger sample.
For example, suppose the height of 5 students (in inches) is 50.55.60. 65. 70. Now. the average height will be calculated by adding all these observations and dividing the sum by 5 then we get 60 inches. If we select a sample of two students with heights of 50 and 60 inches, then the average height of the sample will be 50 + 60 divided by 2, we get 55 inches. Here the sampling error of the estimate will be 60 (true value) minus 55 (estimate) = 5.
Question 4.
What is random sampling? Explain briefly.
Answer:
Random sampling is where the individual units from the tire population (samples) are selected at random. For instance, the government wants to determine the impact of the rise in petrol price on the household budget of a particular locality. For this, a representative (random) sample of 30 households has to be taken and studied. The names of all the 300 households of that area are written on pieces of paper and mixed well, then 30 names to be interviewed are selected one t by one.
In random sampling, every individual has an equal chance of being selected and the individuals who are selected are just like the ones who are not selected. In the above example. all the 300 sampling units of the population got an equal chance of being included in the sample of 30 units and hence the sample. such drawn. is a random sample. This is also called the lottery method. The same could be done using a random number table also.
![]()
VII. Project-oriented question
Question 1.
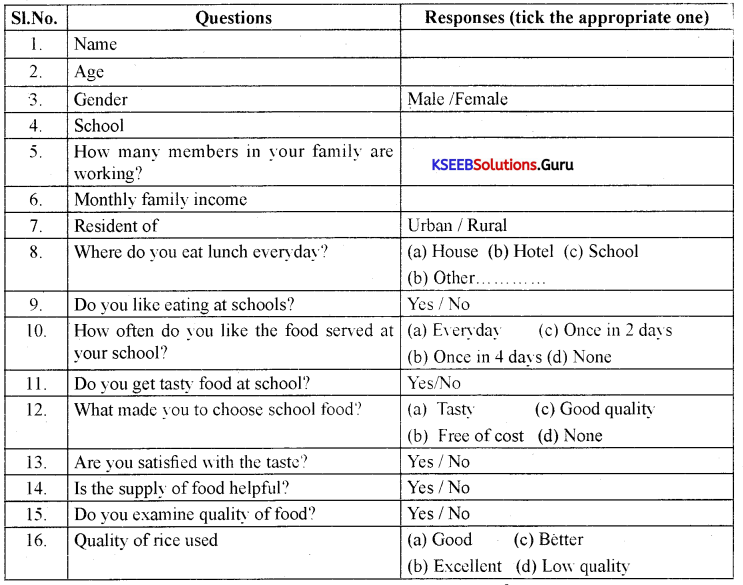
Suppose you are a research student and you are asked to conduct a sample survey about the mid-day meals program in schools. Prepare a good questionnaire to support your survey.
Answer:
1st PUC Economics Collection of Data Additional Questions and Answers
Question 1.
Frame at least four appropriate multiple-choice options for the followiñg questions.
Answer:
(i) Which of the following is the most important factor when you buy a new dress?
(a) Colour
(b) Price
(c) Quality
(d) Fashion
(ii) I-low often do you use computers?
(a) Once in 2 days
(b) Twice a week
(c) every day
(d) Not at all
![]()
(iii) Which of these newspapers do you read regularly?
(a) Deccan Herald
(b) The Hindu
(c) Prajavani
(d) Times of India
(iv) Rise in the price of petrol is justified.
(a) Agree
(b) Partially agree
(c) Disagree
(d) None of these
(v) What is the monthly income of your family?
(a) Less than Rs.25.00()
(b) Rs.25,001 to 50.000.
(b) Rs.50.001 to 75000
(d) Above 75.001
Question 2.
Frame five two-way questions (with ‘Yes’ or ‘No’).
Answer:
(i) Is inflation justified always? (Yes/No)
(ii) Does fall in once lead to overproduction? (Yes/No)
(iii) Is there an alternative for chemical fertilizers in Agriculture9 (Yes/No)
(iv) Cant we control the rate of growth of the population? (Yes/No)
(y) Have we achieved 100% literacy in India” (Yes/No)
Question 3.
State whether the following statements are True or False.
Answer:
(I) There are many sources of data. (False)
(ii) Telephone survey is the most suitable method of collecting data. when the population is literate and spread over a large area. (True)
(iii) Data collected by the investigator is called secondary data. (False)
(iv) There is a certain bias involved in the non-random selection of samples. (True)
(v) Non-sampling errors can be minimized by taking large samples. (True)
Question 4.
What do you think about the following questions? Do you find any problem with these questions? Describe.
(i) How far do you live from the closest market?
This question is too long and not precise for the information required to be collected. Instead of this, the question should have been asked as ‘where do you live?.
(ii) If plastic bags are only 5% of our garbage, should they be banned?
The question should not be a leading question that gives some clue about how the respondent should answer. The above question gives clue to the respondent to say ‘yes’ or ‘no’ immediately. The question should have been ‘‘Is the ban on plastics justified?”.
(iii) Wouldn’t you be opposed to increasing in price of petrol?
The question should not use double negatives. The questions starting with wouldn’t/ should be avoided as they may lead to biased responses. The above question starts with wouldn’t. The question should be as “Do you oppose an increase in the price of petrol?”.
![]()
(iv) Do you agree with the use of chemical fertilizers?
(v) Do you use fertilizers in your fields?
(vi) What is the yield per hectare in your field?
The series of questions should move from general to specific. The questionnaire should start from general questions and proceed to more specific ones. This helps the respondents feel comfortable. The sequence of questions should have been:
- How many quintals do you grow from each hectare?
- Do you use chemical fertilizers in your fields?
- Do you think the use of chemical fertilizers is justified?
Question 5.
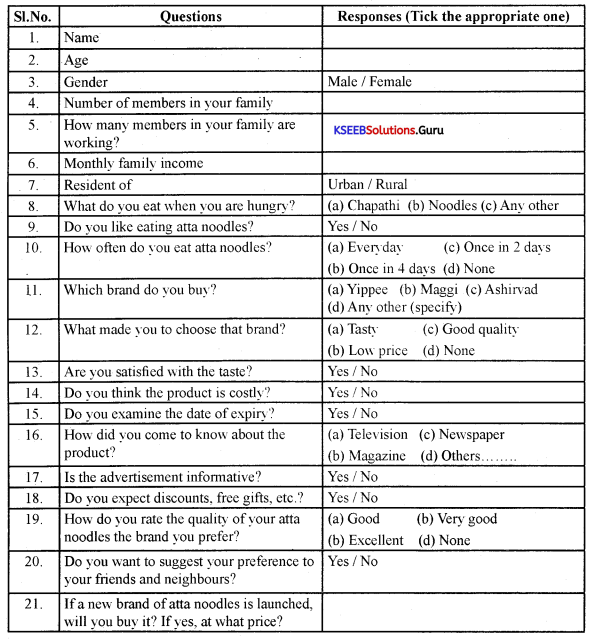
You want to do research on the popularity of vegetable atta noodles among children. Design a suitable questionnaire for collecting this information.
The following questionnaire may be used to do research on the popularity of vegetable atta noodles among children. The survey is targeted at PUC students.
You are requested to fill/answer the following questions against each box provided on the right side. This survey is done to know the popularity of vegetable atta noodles. Your responses will be kept confidential.
Question 6.
In a village of 200 farms, a study was conducted to find the cropping pattern. Out of the 50 farms surveyed, 50% grew only wheat. What are the population and the sample size?
Answer:
The population is 200 farms and the sample size is 50.
![]()
Question 7.
Give two examples each for sample, population, and variable.
Answer:
A sample refers to a group or section of the population from which information is to be obtained.
Example 1:
Research problem: To study the economic condition of agricultural laborers in the Mandya district of Karnataka.
Sample: Ten percent of the agricultural laborers in the Mandya district.
Population: All agricultural .labourers in Mandya district.
Variable: Economic condition (average income of agricultural laborers)
Example 2:
Research problem: To know the literacy rate in the Bengaluru rural district of Karnataka Sample: Twenty percent of the total population of the district.
Population: The population between the age group of 20 – 30 years.
Variable: Literacy rate.
Question 8.
Which of the following methods gives better results and why?
(a) Census
(b) Sample
Answer:
Out of census and sample methods of survey, the sampling method gives better results when compared to the census method.
The census method requires huge expenditure, as a large number of enumerators have to be employed. Alternatively, we can select a representative sample of a few individuals to find out the variable.
Most of the surveys are sample surveys and not census surveys. This is because the sample can provide reasonably reliable and accurate information at a lower cost and shorter time. As samples are smaller than the population, more detailed information can be collected by conducting intensive inquiries. As we need a smaller team of enumerators, it is easier to train them and supervise their work more effectively.
![]()
Question 9.
Which of the following errors is more serious and why?
(a) Sampling error
(b) Non-sampling error
Answer:
Non-sampling errors are more serious than sampling errors because a sampling error can be minimized by taking a larger sample. But it is difficult to minimize non-sampling error even by taking a large sample. Census contains non-sampling errors.
The non-sampling errors include errors in data acquisition. non-response errors and sampling bias. The errors in data acquisition lenses from a recording of incorrect responses. The non-response errors occur if an interviewer is unable to contact a person listed in the sample refuses to respond and the sampling bias occurs when the sampling plan lias has not included the target population.
Question 10.
Suppose there are 10 students in your class, you want to select three out of them. How many samples are possible?
Answer:
In order to select 3 out of 10 students in the class. only three samples are possible. Here random sampling is adopted. A representative sample of 3 students is taken.
Question 11.
Discuss how you would use the lottery method to select 3 students out of 10 in your class?
Answer:
Random sampling (lottery method) is the method where the individual units from the population (students) are selected at random. To select 3 students out of 10 students. the names of all the 10 students of the class arc written on pieces of paper and miNed well. then 3 students to be taken for study are selected one by one.
In random sampling also known as the lottery method, every individual has an equal chance of being selected and the individuals who are selected are just like the ones who are not selected.
Question 12.
Explain the procedure for selecting a random sample of 3 students out of 10 in your class by using random number tables.
Answer:
Random number tables have generated to guarantee equal probability of’ selection of every individual unit in the population. The can be created with the help of calculators and computers. We can start using the table from anywhere i.e. from a page. column. row or point.
For instance, in the case of selecting a random sample of 3 students out of 10 in our class, here the largest serial number is 10. a two-digit number and therefore we consult two-digit random numbers in sequence. We can skip the random numbers greater than 10 since the class strength is 10 itself. Thus. the 3 selected students out of 10 are with serial numbers 03, 08. 06.
![]()
Question 13.
Distinguish between primary data and secondary data.
Answer:
If the data is collected b an investigator through conducting an inquiry, it is called primary data whereas the data collected and processed by some other agency. it is called secondary data.
The secondary data can be obtained by reports. document, newspapers. etc.
Question 14.
What are the characteristics of a good questionnaire?
Answer:
- The questionnaire should not be too long
- The series of questions should move from general to specific
- The questions should be precise and clear
- The questions should not be ambiguous. They should enable the respondents to answer quickly, correctly, and clearly
- The questions should not use double negatives
- The questions should not be a leading question that gives clue about how the respondent should answer
- The question should not indicate alternatives to the answer.
Question 15.
Write the merits and demerits of personal interviews.
Answer:
| Merits | Demerits |
| Highest response rate | Most expensive method |
| It allows all types of questions | Possibility of influencing respondents |
| It is better for using open-ended questions | it takes more time |
| Allows for clarification | it is risky sometimes |
Question 16.
Write the advantages and disadvantages of the Mailing Questionnaire.
Answer:
| Advantages | Disadvantages |
| Less expensive | It cannot be used by illiterates |
| It is the only method to reach remote places | It takes more time |
| No influence on respondents | It does not allow explanation of ambiguous questions |
| It maintains the anonymity of respondents | Reactions cannot be viewed |
| It is best for sensitive questions |
![]()
Question 17.
Write the meaning of the pilot survey.
Answer:
If the survey is conducted on a small group to test the questionnaire. it is called a pilot survey.
Question 18.
Name any two national-level agencies which collect, process, and tabulate data.
Answer:
National Sampic Survey Organisation (NSSO). Central Statistical Organisation (CSO). Registrar General of India (RGI). Directorate General ofComniercial Intelligence and Statistics (DGCIS). Labour Bureau. etc.