Karnataka 1st PUC Economics Question Bank Chapter 7 Correlation
1st PUC Economics Correlation TextBook Questions and Answers
I. Answer the following questions in a word sentence (each question carries 1 mark).
Question 1.
What is correlation? (N – 2018)
Answer:
Correlation studies and measures the direction and intensity of relationship among variables
Question 2.
What is a scatter diagram?
Answer:
A scatter diagram is a diagram to visually present the nature of the association without giving any specific numerical value. It is a useful technique for visually examining the form of relationship, without calculating any numerical value.
![]()
Question 3.
Write the formula for Spearman’s rank correlation.
Answer:
RS = \(\frac{6 \Sigma \mathrm{D}^{2}}{\mathrm{~N}^{3}-n}\)
II. Answer the following questions in about four sentences (each question carries 2 marks)
Question 1.
Why is ‘r’ preferred in place of covariance as a measure of association?
Answer:
Correlation coefficient (v) is preferred to covariance as it has no unit and is independent of origin as well as scale.
![]()
Question 2.
Mention the types of correlation.
Answer:
There are two types of correlation negative correlation and positive correlation. Again they are classified as perfect positive and perfect negative correlations.
Question 3.
What is a negative correlation? Give an example. (S – 2018)
Answer:
The correlation is said to be negative when the variables move in opposite directions.
Example:
- When the price of tomatoes increases, the demand for tomatoes decreases.
- More is the time spent on studies, less are the chances of failure.
Question 4.
What is a positive correlation? Give an example.
Answer:
The correlation is said to be positive when the variables move together in the same direction. Example:
- When our income increases, our consumption also increases.
- When there is a rise in temperature, there will be an increase in the sales of cool drinks.
Question 5.
What are perfect positive correlation and perfect negative correlation?
Answer:
The perfect positive and perfect negative correlations can be represented in a diagram. If all the points lie on the upward sloping line, it is called a perfect positive correlation.
- If all the points lie on the downward sloping line, it is called a perfect negative correlation.
- In both cases, the points themselves are on the lines.
Question 6.
Give an example where correlation does not exist.
Answer:
If ‘r’ is zero, the two variables are uncorrelated. That means, there is no linear relation between ‘r’ them. However other types of relations may be there. Fo{ example: The relationship between food and marks secured are uncorrelated.
![]()
Question 7.
Mention the different techniques for measuring correlation.
Answer:
There are three important techniques used to measure correlation.
They are as follows:
- Scatter diagrams
- Karl Pearson’s coefficient of correlation
- Spearman’s rank correlation.
Question 8.
Mention which type of correlation is associated with:
(a) Production and price of vegetables.
(b) Temperature and sale of ice creams.
Answer:
(a) There is a negative correlation between production and the price of vegetables. If the production of vegetables increases, which leads to an increase in supply, it will result in a decrease in the price of vegetables.
(b) There is a positive correlation between temperature and the sale of ice creams. If the temperature increases, there will be an increase in the sales of ice creams and vice versa.
Question 9.
Interpret the values of r as 1, -1, and 0.
Answer:
When r = 1, it shows there is a perfect positive correlation between two variables.
When r= -1, it shows that there is a perfect negative correlation between two variables.
When r = 0, it shows that there is no relationship between the two variables.
![]()
Question 10.
How does the rank correlation coefficient differ from the Pearson Ian correlation coefficient?
Answer:
| Spearman’s rank correlation | Karl Pearson’s correlation |
| 1. It measures the correlation coefficient for qualitative data. | 1. It measures correlation for quantitative data. |
| 2. It calculates the rank differences. | 2. It calculates deviations from the mean. |
| 3. It gives less importance to the extreme values as it gives them rank. | 3. It gives more importance to extreme values as it is based on actual values. |
Question 11.
What is causation? Does correlation imply causation?
Answer:
Causation just implies the cause and effect relationship between two variables. Correlation measures do not imply causation. Correlation studies and measures the direction and intensity of relationships among variables. Correlation measures covariation and not causation. It provides only a quantitative measure and does not give a cause and effect relationship between the variables.
III. Answer the following questions in about twelve sentences, (each question carries 4 marks)
Question 1.
Calculate the correlation between the heights of fathers (x) and that their sons (y) inches
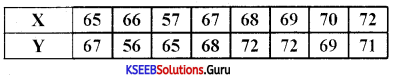
Answer:
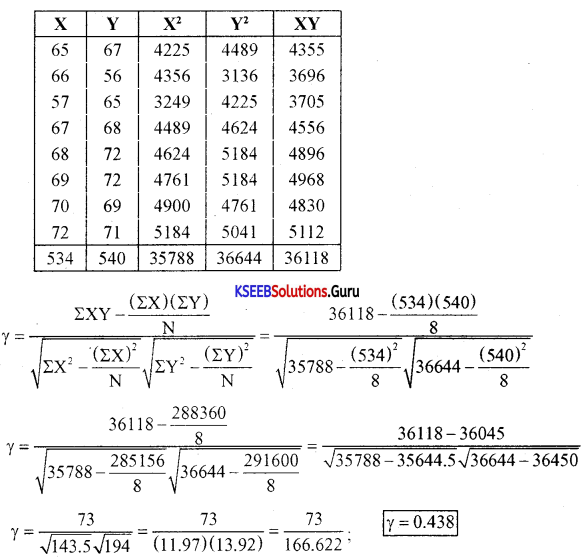
There is a low degree of positive correlation between the heights of fathers and sons.
Question 2.
Calculate the correlation coefficient between X and Y, and comment on their relationship.

Answer:
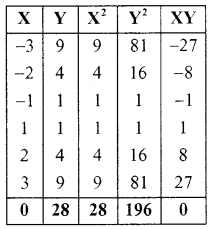
γ = \(\frac{0}{\sqrt{28} \sqrt{65.34}}=\frac{0}{(5.29) \times 8.08}=\frac{0}{42.74}\)
γ = 0
![]()
Question 3.
Calculate the correlation coefficient between X and Y and comment on their relationship.
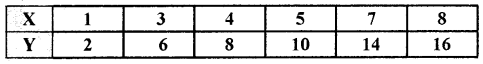
Answer:
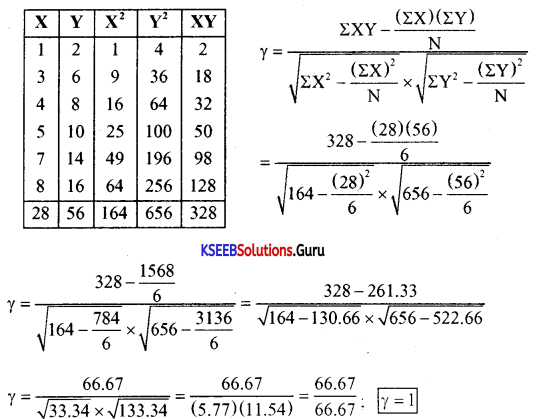
There is a perfect positive correlation between the values of X and Y.
Question 4.
Mention the properties of the correlation coefficient (any four).
Answer:
The following are the major properties of the correlation coefficient:
- Correlation ‘r’ has no unit, it is a pure number. It means units of measurement are not part of ‘r’
- A negative value of ‘r’ indicates an inverse relation. A change in one variable is associated with a change in the other variable in the opposite direction. For instance, when the price of tomatoes increases, their demand decreases.
- If “r” is positive the two variables move in the same direction. When the price of coffee rises, a substitute for tea, the demand for tea increases.
- The value of the correlation coefficient lies between minus one and plus one. (-1 < r < 1).
- If r = 0, the two variables are uncorrelated. There is no linear relation between them. However, other types of relations may be there.
- If r = 1 or r = -1, the correlation is perfect. The relation between them is exact.
- A low value of ‘r’ indicates a weak linear relation. Its value is said to be low when it is close to zero.
- The magnitude of ‘r’ is unaffected by the change of origin and change of scale.
![]()
Question 5.
Draw the scatter diagram and conclude about correlation. (Board Paper)
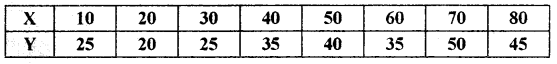
Answer:
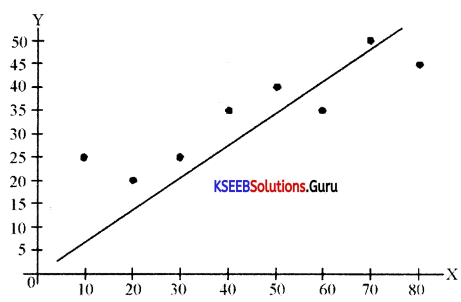
Conclusion: There is a positive correlation between the X and Y variable.
Question 6.
Draw the scatter diagram and interpret. (S – 2018)
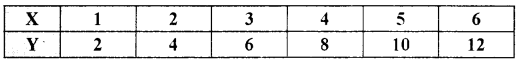
Answer:
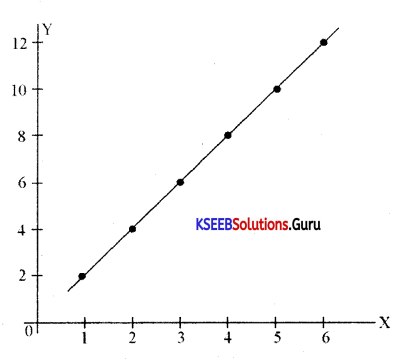
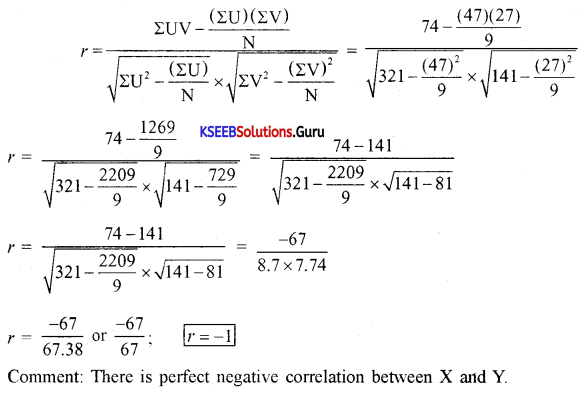
Interpretation: There is a perfect positive correlation between X and Y.
Question 7.
Draw the scatter diagram and comment about the correlation
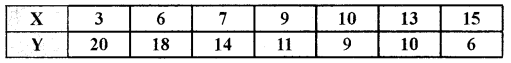
Answer:
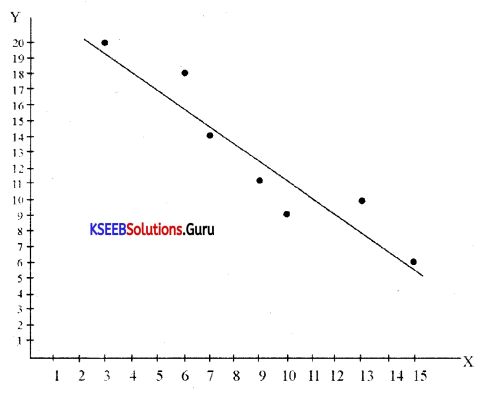
Comment: There is a negative correlation between X and Y.
![]()
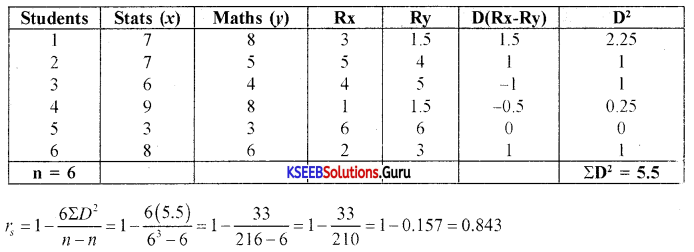
Question 8.
Calculate the product-moment coefficient of correlation between the following marks (out of 10) in statistics and mathematics of six students.
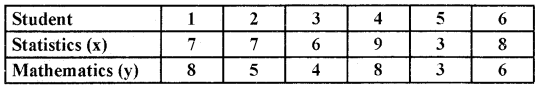
Answer:
IV. Answer the following in about twenty sentences (each question carries 6 marks)
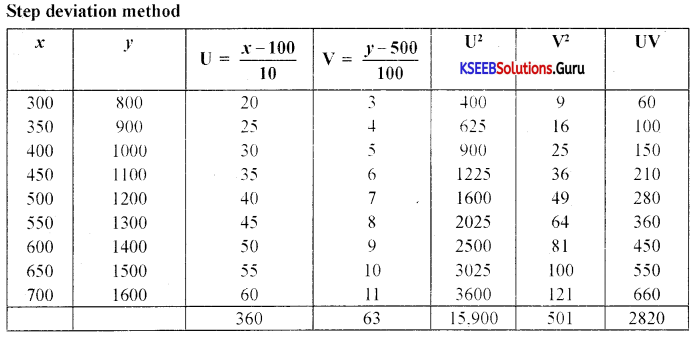
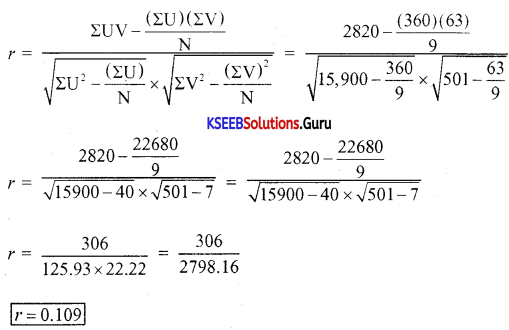
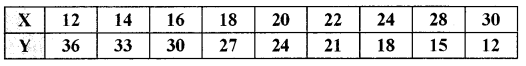
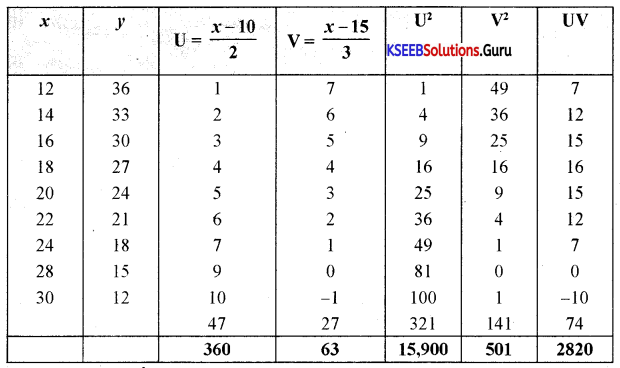
Question 1.
Calculate Karl Pearson’s coefficient of correlation for the following data using step deviation method.
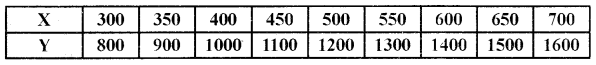
Answer:
![]()
Question 3.
Calculate Karl Pearson’s coefficient of correlation from the following data using the step deviation method and comment on the result.
Answer:
Question 4.
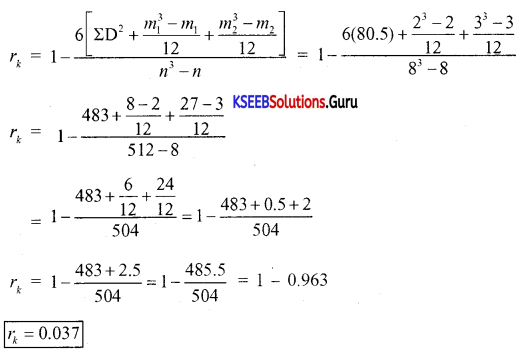
Calculate the coefficient of rank correlation.
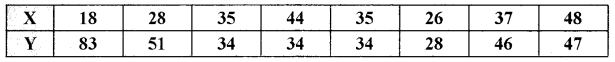
Answer:
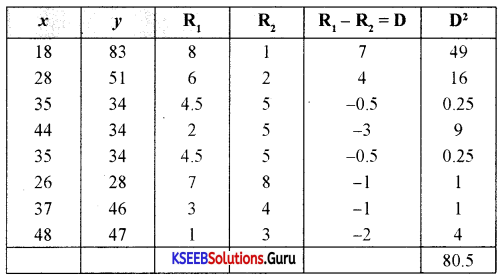
Here. the number 35 repeated twice in x series and number 34 repeated thrice in y’ series, therefore in x. m = 2. in y m = 3. then apply the formula
n=8. Σ D2 = 80.5
![]()