Students can Download 1st PUC Statistics Model Question Paper 3 with Answers, Karnataka 1st PUC Statistics Model Question Papers with Answers helps you to revise the complete Karnataka State Board Syllabus and score more marks in your examinations.
Karnataka 1st PUC Statistics Model Question Paper 3 with Answers
Time: 3 Hrs 15 Min
Max. Marks: 100
Note :
- Graph sheets and statistical tables will be supplied on request.
- Scientific calculators may be used.
- All working steps should be clearly shown.
Section-A
I. Answer any TEN of the following questions. (10 × 1 = 10)
Question 1.
Give any one definition of statistics in singular sense.
Answer:
Croxton and Cowden defines ‘statistics is the science of collection, presentation, analysis and interpolation of numerical data.’
Question 2.
Give an example for ordinal data.
Answer:
Ranks are given to students according to their marks scored in examination.
Question 3.
Define qualitative classification?
Answer:
If the data is classified on the basis of qualitative characteristics or attributes is called qualitative classification.
Question 4.
Define the relative frequency.
Answer:
It is the ratio of frequency of the value of a variable to the total frequency.
Question 5.
Find the mode for the following data. 4, 1, 0, 2, 3, 2, 0, 2, 1, 2, 5, 0, 1, 2.
Answer:
Mode (z) = 2 (which is repeated more times).
![]()
Question 6.
What is the false base line used in the graph?
Answer:
In order to use the space on the graph effectively a line, shown by vertical wavy line between zero and the first scale or the axes can be broken by kinked line.
Question 7.
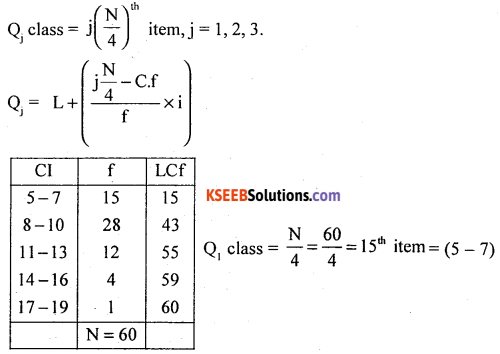
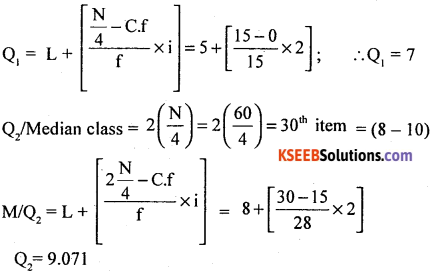
Write down a formula to find Bowley’s coefficient of skewness.
Answer:
Question 8.
Give an example for a negative correlation.
Answer:
Rise in prices of vegetables and sales.
Question 9.
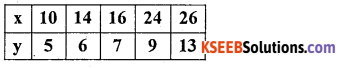
Write the relation between the coefficient of correlation and the standard deviations in regression coefficient of x on y.
Answer:
The regression coefficient of x on y = bxy = γ \(\frac{\delta x}{\delta y}\)
Question 10.
Write any one assumption in Binomial method of interpretation.
Answer:
The rate of change figures from one period to another is uniform.
Question 11.
Define random experiment.
Answer:
An experiment in which the outcome of that experiment cannot be predictable is called random experiment.
Question 12.
Write the formula of variance of a random variable.
Answer:
Var(X) = E(x2) – [E(X)]2
Section-B
II. Answer any TEN of the following questions. (10 × 2 = 20)
Question 13.
Mention the divisions of statistics.
Answer:
The main branches/divisions of statistics are
- statistical methods and
- applied statistics.
Question 14.
Define discrete and continuous variables.
Answer:
- A variable which assumes only specified values in the given range is a discrete variable.
- A variable which assumes all the possible values within the given range of the data is a continuous variable.
Question 15.
Write down the frequency density and relative frequency formulae.
Answer:

Question 16.
What are source and foot note are meant for in the table?
Answer:
Source and foot note are written just below the table. The data obtained from publications, offices, journals can be mentioned under source and to explain omissions, abbreviations, remarks about numerical entries of the table can be given under the footnote.
![]()
Question 17.
Mention the purpose of drawing histogram and ogives for a frequency distribution.
Answer:
From the histogram the pattern of distribution of frequencies in the frequency distribution can be studied and from the ogives number of frequencies/a variable like above or below the given variable/frequency can be studied.
Question 18.
What do you mean by measures of position or positional averages? Mention different measures.
Answer:
Measures which divides the data into equal parts are called positional averages.
The different measures are :
- Quartiles (with median)
- Deciles
- Percentiles
Question 19.
Mention the type of skewness from the following frequency distribution.
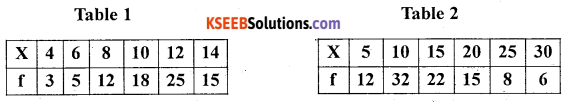
Answer:
In table, there is more concentration of the frequencies at the end of the distribution, compared to the beginning, so the distribution is negatively skewed.
In table 2, there is more concentration of the frequencies at the beginning of the distribution, compared to the end, so the distribution is positively skewed.
Question 20.
Mention values of coefficient of kurtosis for a Platykurtic distribution and leptokurtic distribution.
Answer:
For a platykurtic distribution the coefficient of kurtosis β2 < 3 and for a Leptokurtic distribution β2 > 3.
Question 21.
Define positive and negative correlation with one example each.
Answer:
If the variables vary in the same direction is called positive correlation:
Ex : Demand and supply.
If the variables vary in the opposite direction is called negative correlation
Ex : price and demand
Question 22.
When the two regression lines intersect and coincide ?
Answer:
The two regression lines intersect at (x̄,ȳ) and they coincide where there is a perfect correlation.
Question 23.
How do you interpret in the Yales’ coefficient of association Q = -ve and Q = +ve
Answer:
If Q = -ve there is negative association or dissociation and if Q = +ve there is a positive association between the attributes.
Question 24.
Show that 0 ≤ P(A) ≤ 1.
Answer:
By the definition of probability P(A) = \(\frac { m }{ n }\)
Here m the favourable event can take the least value 0 and the highest value n.
i.e. 0 ≤ m ≤ n (by mathematical law)
\(\text { i.e. } \frac{0}{n} \leq \frac{m}{n} \leq \frac{n}{n}\)
0 ≤ P(A) ≤1.
Hence the proof.
Question 25.
Define p.m.f. (probability mass function)?
Answer:
Let X is a discrete random variable with respective probability P(X): P(X=x), then P(X) is called p.m.f. if :
- P(x) ≥ 0 for all value of x.
- ΣP(X) = l
![]()
Section-C
III. Answer any EIGHT of the following questions. (8 x 5 = 40)
Question 26.
What are the causes of distrust of statistics?
Answer:
Following are the causes of distrust of statistics :
- Figures can easily be believed.
- Quoting only figures for reference.
- Ignoring the limitations of statistics.
- Inadequate and improper samples for verification.
- Untrained and lack of knowledge in statistics.
Question 27.
Define secondary data and in short explain different sources of secondary data.
Answer:
Secondaty data are those which are collated already by some other persons and which are published in Journals, magazines, news papers etc.
- Secondary data mas be published unpublished.
- Publisheds official publications of the state and Central Govt.
- Foreign or international bodies sockets UNO, INF, etc.
- Unpublished sources: Govt records, municipal offices, research records etc.
Question 28.
In the year 2010 in Bangalore 1200 accidents occurred. Of all the accidents 918 were fatal deaths. Out of total accidents 450 were bike accidents, 380 ends in death of drivers, 150 accidents occurred due to auto and car ends with 58 deaths. Remaining accidents were hit and run cases of which 80% were end the life of pedestrians. Tabulate the above information.
Answer:
Table showing vehicle accidents in Bangalore in the year 2010
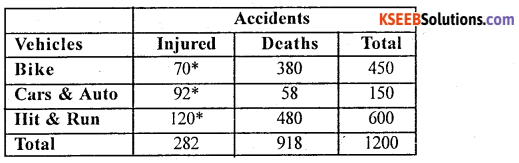
Source : Imaginary
Fact Note : 80% of 600 = \(\frac { 80 }{ 100 }\) × 600 = 480 ,
* Computed Figures
Question 29.
Compute mode from the following data :

Answer:
Let x and y be IQ and number of children.
Modal class = size of highest frequency
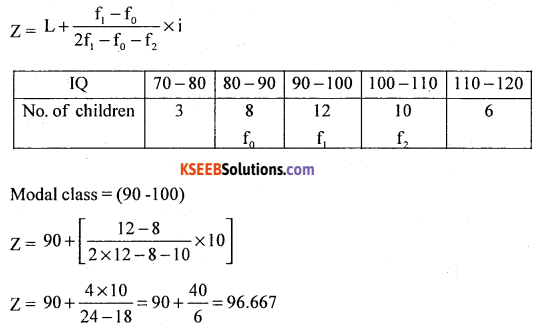
![]()
Question 30.
Following is the data regarding the height and weight of students. Find the coefficient of correlation using Person’s method.
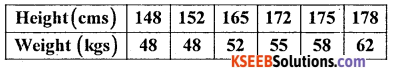
Answer:
Let X and Y be the height and weight.

Here dx = x – A = x – 165, dy = y – B = -55
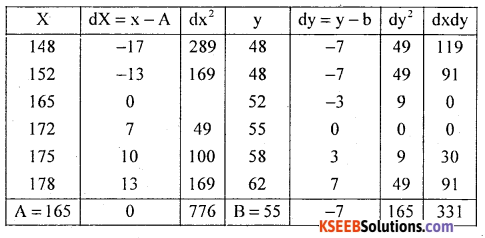
n = 6
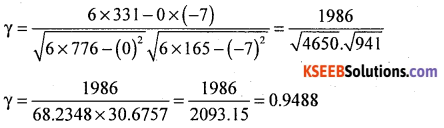
There exists high degree positive correlation between height and weight.
Question 31.
The two regression equations : the regression equation of X on Y is 10x – 2y = 4 and regression equation of Y on X is 2y – 5x = 8. Find x̄, ȳ and γxy.
Answer:
Consider regression equation of x on y:
10x – 2y = 4; 10x = 2y + 4
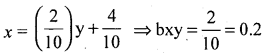
regression equation of y on x : 2y – 5x = 8
2y = 5x + 8
\(y=\frac{5}{2} x+\frac{8}{2}\)
⇒ byx = 2.5
∴ gxy = ±\(\sqrt{\mathrm{bxy} \cdot \mathrm{byx}}=\sqrt{0.2 \times 2.5}\) = 0.7071 .
Solving the two regression equations
10x – 2y = 4
2y – 5x = 8
i.e. 10x – 2y = 4
2y – 5x = 8
i.e. 10x – 2y =4
(+) -5x + 2y = 8
5x = 12,x = \(\frac { 12 }{ 5 }\) ⇒ x̄ = 2.4
put x̄ = 2.4 in 2y – 5x = 8
2y – 5(2.4) = 8
2y = 8 +12.0
y = \(\frac { 20 }{ 2 }\) = 10 ⇒ ȳ = 10
![]()
Question 32.
Find Yule’s coefficient of association from the following data.

Answer:
The given table can be written as below
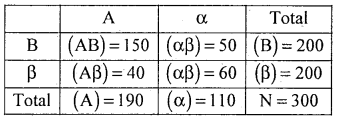
The Yule’ s coefficient of Association
∴ Q = 0.6303
There exsits positoive association between A and B.
Question 33.
Find missing premium payable for the age group 35 per thousand of a Insurance Policy from the following data.

Answer:
Using binomial expression method :
Since 4 known values of y are given so,
Δ04 = (y – 1)4 = 0
i.e y4 – 4y3 + 6y2 – 4y1 + y0 = 0

42 – 4 × 35 + 6y2 – 4 × 26 + 23 = 0
42 – 140 + 6y2 – 104 + 23 = 0
6y2 – 179 = 0
y2 = \(\frac { 179 }{ 6 }\) = 29.83
∴ The premium for the age 35 is ₹ 29.83
Question 34.
State and prove addition theorem of probability for two mutually exclusive event
Answer:
Statement: Let A and B be two mutually exclusive events with respective probabilities P(A) and P(B). Then the probability of occurrence of atleast one of the events is –
P (A ∪ B) = P(A) + P(B)
Proof: Arandom experiment results ‘iV exhaustive mutually exclusive out comes, of which m. and m2 outcomes are favorable to events A and B.
Then P(A) = \(\frac{m_{1}}{n}\)
P(B) = \(\frac{m_{2}}{n}\) Results (1)
Here the favourable events to occur either A or B are (m1 + m2)

P (A ∪ B) = P(A) + P(B)
Hence the proof.
Question 35.
A bowl contains 8 balls – 5 white and 3 balls. Two balls are drawn at random one after the other. Find the balls drawn are both white
(i) with replacement
(ii) without replacement.
Answer:
Let P(A) – probability of drawing a white ball in the first draw and
P(B) – probability of drawing a white ball in the second draw.
(i) With replacement the events are independent
= P(2 white balls) = P(A ∩ B) = P(A) P(B) = \(\frac { 5 }{ 8 }\) × \(\frac { 5 }{ 8 }\) = \(\frac { 25 }{ 04 }\)
(ii) Without replacement, second event is dependent on the first event
P(2 white balls) =P(A ∩B) = P(A)P(B/A) = \(\frac { 5 }{ 8 }\) × \(\frac { 4 }{ 7 }\) = \(\frac { 20 }{ 56 }\)
![]()
Question 36.
A fair die is thrown once. A person will get ₹ 5 if the die results in multiplying 3. Otherwise he loses ₹ 2. Find his expectations.
Answer:
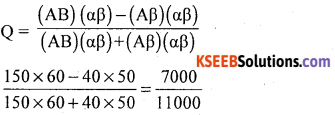
Let X denote expected amount, which takes the values X : 5 and -2. With respective probabilities as:
P(x = 5) = P(getting muItiple of 3)
= \(\frac { 2 }{ 6 }\) ; {i.e. 3,6}
P(x = 2) = \(\frac { 4 }{ 6 }\) ;{i.e. 1,2,4,5}
The probability of distribution is
Expected amount: E(X) = ΣX.P(X)
= 5 × \(\frac { 2 }{ 6 }\) – 2 × \(\frac { 4 }{ 6 }\) = 1 – 67 – 1.33 = 0.34 i.e. 34 paise gain.
Section-D
IV. Answer any TWO of the following questions. (2 × 10 = 20)
Question 37.
Following is the data regarding the prices (₹) of onion in Bangalore and Chitradurga collected in 6 weeks on every Monday of marked day.

(i) which town shows more price on average.
(ii) which town shows more consistent and stable in price.
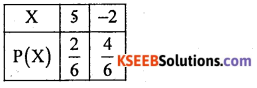
Answer:
Let x and y be the prices in Banglore and chitradurga
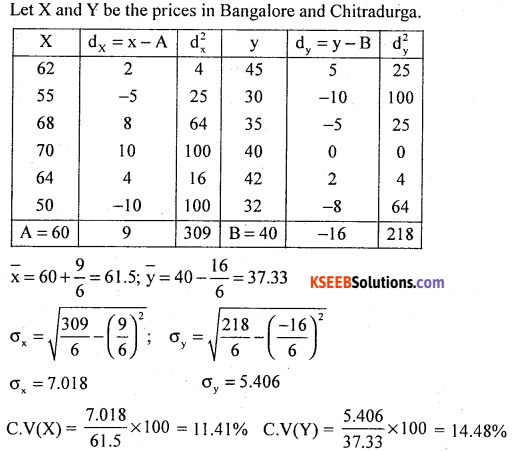
(i) Here X̄ = 61.5 and Ȳ = 37.33
Bangalore process shows more process than average
(ii) C.V(X) = 11.4% ; C.V(Y) = 14.48%
Bangalore priles average more consistent and stable in price.
Question 38.
Calculate Bowleg’s coefficient of skewness.
Answer:
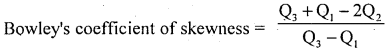
Compute Quartiles using the following procedure.
After calculating L.C.f
The distribution is positively skewed.
![]()
Question 39.
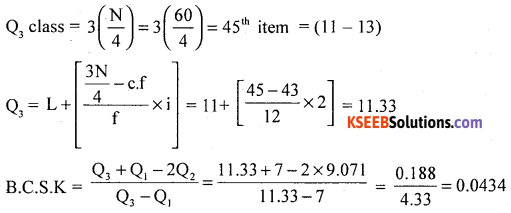
For the following data :
(a) Calculate two regression equations
(b) Estimate the value of x when y = 30
(c) Determine the value of correlation coefficient using regression coefficients.
Answer:
The two regression equations are :
(x – x̄) = bxy (y – ȳ)
(y – y) = byx (x-x)
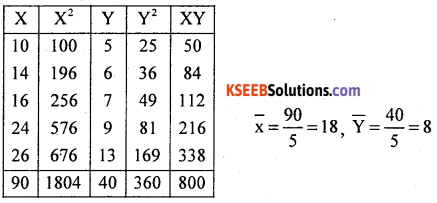
(i) The regression equation of x on y:
(x – x̄) = bxy (y – ȳ)
x – 18 = 2 (y – 8)
x = 2y + 2
The regression equation of y on x:
y – ȳ = byx (x – x̄)
y – 8 = 0.4348 (x -18)
y = 0.4348x + 0.1736
(ii) Estimation of x when y = 30
x = 2y + 2 = 2(30) + 2 = 62
(iii) γ = ±\(\sqrt{b_{x y} \cdot b_{y x}}=\sqrt{2 \times 0.4348}\) = 0.9325
Section-E
IV. Answer any TWO of the following questions. (2 × 5 = 10)
Question 40.
(a) The odds favouring the event of a person A hitting a volley are 2 to 5. The odds against the event of another person B hitting a volley are 1 to 5. If both shoot at a volley, then find the probability that (i) both of them hit (ii) at least one of them hit the volley.
Answer:
Let P(A) = probability that person A hit a volley = \(\frac { 2 }{ 2 + 5 }\) = \(\frac { 2 }{ 7 }\) ∴ P(A’) = \(\frac { 5 }{ 7 }\)
and P(B’) = probability that a person B not hitting a target = \(\frac { 1 }{ 1 + 5 }\) = \(\frac { 1 }{ 6 }\)
∴ P(B) = \(\frac { 5 }{ 6 }\)
(i) P(both of them hit) = P(A ∩ B) = P(A).P(B)
Both are independent so,
\(=\frac{2}{7} \times \frac{5}{6}=\frac{10}{42}=0.238\)
(ii) P (at least one of them will hit)
= P(A ∪ B) = P(A) + P(B)-P(A ∩ B)
\(=\frac{2}{7}+\frac{5}{6}-\frac{2}{7} \times \frac{5}{6}=0.88\)
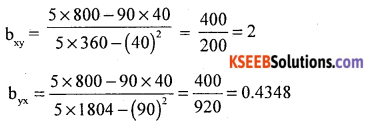
(b) A die is thrown once. Find the expectation of the numbers obtained on the faces of a die.
Answer:
Let X denote the numbers obtained when a die is thrown which takes the values
x: 1,2,3,4, 5,6 with each having probability \(\frac { 1 }{ 6 }\)
The probability distribution is
Expected number : E(X) = ΣX.P(X)
= \(1 \times \frac{1}{6}+2 \times \frac{1}{6}+3 \times \frac{1}{6} \times \ldots .6 \times \frac{1}{6}\)
= \(\frac { 1 }{ 6 }\) [l + 2 + ….6] = \(\frac { 1 }{ 6 }\)(21) = 3.5
![]()
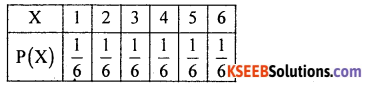
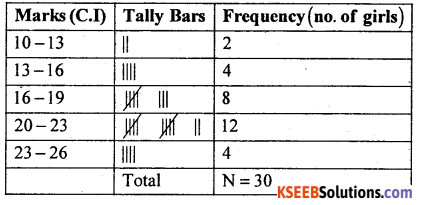
Question 41.
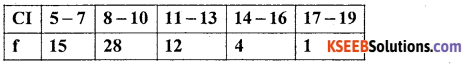
Following is the data regarding the marks obtained by a certain group of girls in a class in statistics test.
Prepare a frequency table.
Answer:
Table showing the marks obtained by the girls in the statistics test.
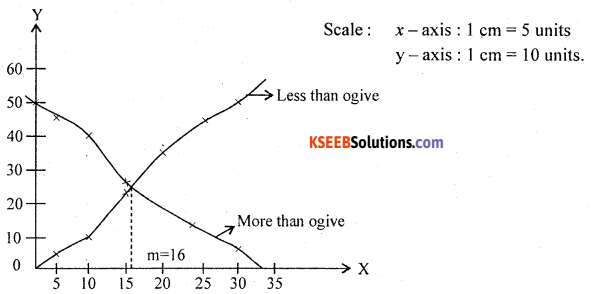
Question 42.
Draw less than and more than ogives from the following frequency distribution. Find the median.
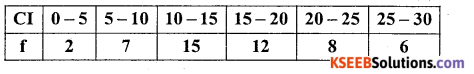
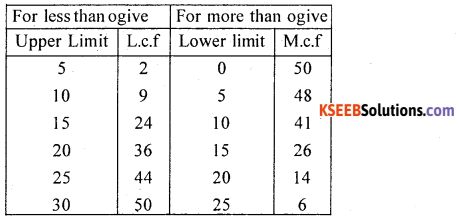
Answer:
OGives of Frequency Distribution
![]()
Question 43.
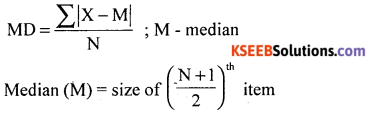
Compute mean deviation from median for the following data. Also compute its relative measure.
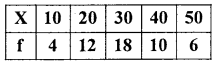
Answer:
Question 44.
Two dice are rolled. Find the probability of that
(i) the faces of dice are of same number
(ii) the sum is 5.
Answer:
(i) n = total no. of outcomes when two dice are rolled. = 62 = 36
P (A) = P(The faces of dice are of same no.)
m = [(1,1) (2,2) (3,3) (4,4) (5,5) (6, 6)] = 6
P (A) = \(\frac { 6 }{ 36 }\) = \(\frac { 1 }{ 6 }\)
(ii) m = sum is 5 = [(1,4) (2,3) (3,2) (4,1)] = 4 4 1
p (sum is 5) = \(\frac { 4 }{ 36 }\) = \(\frac { 1 }{ 9 }\)