Karnataka 2nd PUC Economics Important Questions Chapter 2 Theory of Consumer Behaviour
Very Short Answer Type Questions
Question 1.
What do you mean by utility?
Answer:
Utility is the want satisfying power of a commodity.
Question 2.
How is total utility derived from marginal utilites?
Answer:
Total Utility is the sum total of marginal utilities ofvarious units of a commodity.
Question 3.
State the law of equi- marginal utility?
Answer:
It states that a consumer gets maximum satisfaction when the ratio of the marginal utilities ofthe goods and their prices i.e. Mux / Px = MUy/Py
Question 4.
What will you say about Mu the TU is maximum?
Answer:
MU is zero then TU is maximum.
Question 5.
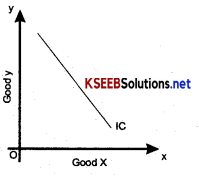
Give the reason behind a convex indifference curve?
Answer:
Diminishing marginal rate of substitution.
![]()
Question 6.
Give the formula for calculating the slope of the budget line?
Answer:
It is equal to the ratio of the prices of the two comodities i.e Px / Py.
Question 7.
Suppose a consumer’s preference are monotonic. What can you say about mis preferece ranking over the bundles (10,10), (10,9) & (9,9)?
Answer:
Consumer will monotonically Prefer bundle (10, 10) to (10, 9) and (9, 9) and also Prefer bundle (10, 9) to (9, 9)
Question 8.
A rise in the income of the consumer leads to a fall in the demand for commodity ‘x’ What type of good is commodity ‘x’?
Answer:
Inferior good.
Question 9.
What do you mean by a substitute and complementary goods? Give two examples each.
Answer:
Substitute goods are those goods which can be used in place of each other.
Ex: Tea and coffee.
Question 10.
Mention one factor that causes a left ward shift of the demand curve?
Answer:
Fall in income of a consumer.
Question 11.
What causes a movement along the demand curve of a commodity?
Answer:
When the price of a commodity changes and other factors remain constant, there will be movement along the demand curve.
![]()
Question 12.
Draw a demand curve with unitary elasticity?
Answer:
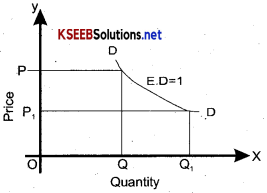
Question 13.
Define Price elasticity of demand?
Answer:
It refers to the degree of responsiveness of quantity demanded to change in price.
Question 14.
What is the indifference curve?
OR
Define the Indifference curve?
Answer:
An Indifference curve is a set of combinations of the two commodities which offer a consumer the same level of satisfaction
Question 15.
The consumer prefers more goods to less, what will be the slope of the indifference curve in that case?
Answer:
In that case, the indifference is downward sloping.
Question 16.
When is the indifference curve convex to origin in that case?
Answer:
In that case, the indifference curve is convex to origin when the consumer prefers average bundles to extreme.
Question 17.
What is the marginal rate of substi-tution?
Answer:
The rate at which the consumer can substitute good -1 for good -2 and be different is called marginal rate of substitution (MRS)
Question 18.
What does the word equilibrium mean?
OR
Give the meaning of equilibrium?
Answer:
Equilibrium means a position of rest or a situation of no change.
![]()
Question 19.
What does consumer’s equilibrium refer to?
Answer:
Consumer’s equilibrium refers to a situation when he spends his given income on purchase of commodity to (or combination of goods) in such a way that yield him maximum satisfaction and he feels no urge to change.
Question 20.
Give the meaning of demand?
Answer:
Demand is the quantites demanded of particular goods and consumer’s willingness to buy it at a particular price with in a given period of time.
OR
Demand refers to desire towards commodity by an individual coupled with willingness and abilities to buy.
Question 21.
Name the determinants of demand?
Answer:
The determinants of demand are:
- Price of a product
- Price of related goods
- Income of consumer
- Taste & preferences of the consumer
Question 22.
What is the law of demand?
Answer:
The law of demand states that when other remaining constant the quantity demanded will increase with fall in price and decrease with the rise in price.
Question 23.
Define an indifference Map?
Answer:
An Indifference map is a collection of indifference curves corresponding to differenat levels of satisfaction. –
Question 24.
In which market form the demand curves of a firm is perfectly elastic?
Answer:
In a perfectly competitive market, the demand curve of a firm is perfectly elastic.
Question 25.
Why is the demand for water inelastic?
Answer:
Demand for water is inelastic because water is an essential and it is abundant.
Question 26.
Give the meaning of marginal revenue?
Answer:
Marginal revenue means the change in the total revenue which results from the sale of one or more unit of a commodity.
Question 27.
Define production function?
Answer:
Production may be defined as the functional relationship between physical outputs and physical inputs of a commodity.
![]()
Question 28.
Define marginal utility?
Answer:
Marginal utility can be defined as an addition to total utility due to increse in one unit of a commodity.
Question 29.
What happens to total expenditure on a commodity when its price falls and its demand is price elastic?
Answer:
Total expenditure will increase.
Question 30.
What causes and upward movement along a demand curve?
Answer:
Increase in the price of a commodity causes an upward movement along the demand curve.
Question 31.
What is market demand?
Answer:
Market demand may be defined as the total quantity of commodity which all the buyers in the market are willing to buy at different prices in a given period of time.
Question 32.
What does decrease in supply refers to?
Answer:
Decrease in supply means that the sellers sell less quantity of a good at its existing price.
Short Answer Type Questions
Question 1.
Qd = 20-2p is a demand equation.
Identify independent variable, dependent variable, constant and co-efficient in it. ,
Answer:
From the equation Qd = 20 -2p
P → Independent variable
Qd → Dependent variable
20 → Constant
2 → co-efficient
Question 2.
Qd = 20-2p is demand function of onion. Suppose the onion in the market is Rs. 10 per kg. Calculate the quantity demanded?
Answer:
When Price is 10
i.e P is 10
Qd = 30 – 2 (p)
Qd = 30 – 2 × 10
Qd = 30 – 20
Qd = 10
The quantity demanded will be 10 kgs.
![]()
Question 3.
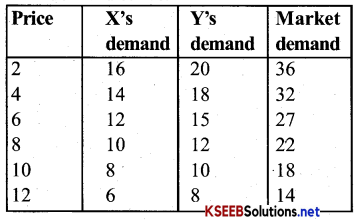
Imagine there are only two consumers in a market. They are x and y. Their demand for a good is given as follows Calculate the market demand for the good & draw the market demand curve.
Answer:
Question 4.
Differentiate ‘total utility’ and ‘marginal utility’?
Answer:
Total Utility:
Total utility refers to the utility which will be obtained by consumption of all units of the commodity.
The marginal utility is the net addition made to the total utility by consuming extra unit of a commodity.
Question 5.
What is the difference between utility and satisfaction.
Answer:
| Utility | Satisfaction |
| 1. Utility is the satisfying power of a commodity, before consumption. | 1. Whereas a consumer get satisfaction only after consumption. |
| 2. Utility is an ‘Expected Satisfaction’. | 2. Whereas it is Realized Satisfaction. |
Question 6.
What are the properties of a Budget line?
Answer:
The properties of a Budget line are:
- The Budget line always slopes downwards from left to right.
- Bundles, whose cost is exactly equal to consumers’ money income lie on the Budget line.
Question 7.
What is the relationship between marginal utility and total utility?
Answer:
Relationship between marginal utility and total utility!
- Total utility increases as long as marginal utility is positive.
- Total utility is maximum when marginal utility is zero.
- The total utility starts declining when marginal utility becomes negative.
Question 8.
What does the law of diminishing marginal utility state?
Answer:
The Law of diminishing marginal utility simply tells us that we obtain less and less marginal utility from the successive units of a commodity as we consume more and more of it.
Question 9.
What do you mean by
(i) Intial utility
(ii) Marginal utilitey
(iii) Total utility?
Answer:
(i) Initial utility:
Initial utility refers to the utility that is derived by consuming the first unit of a commodity. ‘
For Example: Having a first cup of tea to reduce fatigue is the initial utility.
(ii) Marginal utility:
The marginal utility can be defined as the addition to the total utility obtained from the consumption of one more unit.
For Example, The marginal utility of the second unit of a good is the change in total utility resulting from consuming the second unit of the good.
MUn = TUn – TUn-1
(iii) Total utility
Total utility is the amount of utility or satisfaction that a consumer gains from consuming a given amount of goods or services over a period.
For example, A person consumes five units of commodity and derives U1 U2, U3, U4, U5 utility from the successive units of a commodity, then the total utility will be
TU = U1 + U2 + U3 + U4 + U5
Question 10.
When Marginal utility is zero, then utility is maximum prove it with the help of a table.
Answer:
With the help of the following table, we can deduce that total utility is maximum when marginal utility is zero.
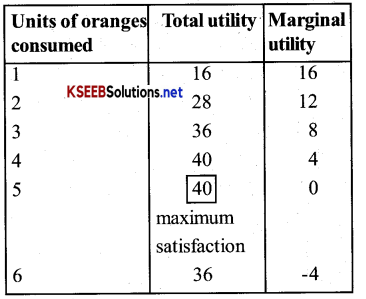
From the above table we come to know that when a consumer, consumes 5 oranges, the marginal utility is zero and at this level the total utility is maximum i. e. 40
Question 11.
Write down the assumptions of law of diminshing marginal utility?
Answer:
Assumptions of law of diminishing marginal utility:
- The units of consumption must be in standard units. eg: a cup of tea, a bottle of cool drink, an apple etc.
- All the units of the commodity must be identical in all aspects like taste, quality, colour & size.
- The units of the commodity should be used continuously if there is any interval between the consumption of two units, then the law will not operate.
- Consumer must be rational. It means, consumer should maximise utility.
- The price ofhe commodity consumed and its substitutes must remain constant.
- Utility can be measured in cardinal numbers like 1,2, 3, 4,…. n units.
- Consumer should be an ordinary person this law is not applicable to extraordinary _ persons.
![]()
Question 12.
Write any four limitations of the law of diminishing marginal utility?
Answer:
- The Law is not applicable to rare collections. Ex: ancient coins, stamps etc
- It is not applicable in case of Prestigious goods Ex: gold, diamonds etc.
- It does not apply to knowledge, art and innovations.
- The law is not applicable to money. The marginal utility of money declines with richness but never falls to zero.
Question 13.
Explain the importance of Law of diminishing marginal utility?
Answer:
The importance of the Law of diminishing Marginal utility:
- By purchasing more units of a commodity, the marginal utility decreases, due to this behaviour, the consumer cuts his expenditure on that commodity. It helps to utilise the resources economically.
- In the field of public finance’, this law has a practical application as the principle of taxation is based on this law.
- This law is the base to ther economic laws such as law of demand, elasticity of demand, consumer surplus, the law of substitution etc.
- The theory of value is based on this law. The value of a commodity falls with an increase in the supply of that commodity. This forms the basis for determining prices.
- This law is the basic for the socialist please for an equitable distribution of wealth.
Question 14.
Differentiate between Substitute goods & complementary goods?
Answer:
| Substitute Goods | Complementary Goods |
| 1. These are those goods which can be used in place of each other to satisfy a given want. Tea & coffee are substitute goods. | 1. These are those goods which are used together to satisfy a given want. They are demanded jointly, i.e. their consumption goes together. Car and petrol are complementary goods. |
| 2. In case of substitute goods there is direct relationship between the demand for the commodity and price of its substitute i.e, increase in price of a commodity will increase demand for its substitutes and decrease in price of the commodity will decrease the demand for its substitutes. | 2. In case of complementary goods, there is inverse relationship between the demand for a commodity and the price of its complementary goods.
For example: Rise in the price of petrol will lead to fall in demand for scooter and fall in price of petrol will lead to rise in demand for scooter. |
Question 15.
How is the market demand curve derived from the individual demand curves?
Answer:
The Market demand curve i.e, the demand curve of a product by all individuals taken together in economy is obtained by horizontally summing up the demand curves across consumer’s or household. Below market demand curve has been drawn with the help of individual demand curves.
Question 16.
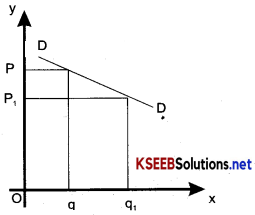
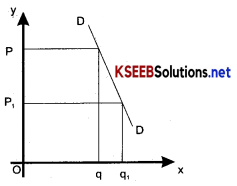
DifFerntiate between shift of the demand curve and movement along the demand curve?
Answer:
Shift of demand curve:
1. Shift of demand curve takes Place due to changes in factors other than the price such as income of the consumer.
2. Shift of demand curve is of two types
- Left side &
- Right side.
3. In case of shift of demand, more is demanded at the same price.
4. Factors other than price change.
5. Shift of demand curve has been shown below diagrammatically.
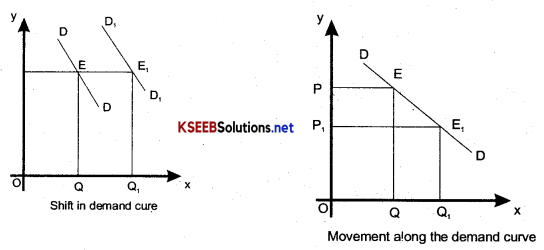
- Movement along the demand curve is caused due to change in price alone.
- Movement along the demand curve is of two types:
(i) Upward movement
(ii) Downward movement. - In case of movement along the demand curve, more is demaded at a lower price and vice -versa.
- Factors other than price remain constant.
- Movement along the demand curve has been shown below diagramatically.
Question 17.
Explain how rise in income influence demand for a good?
Answer:
Effect of change in income of the demand for a commodity.
- Increase in income leads to increase in demand for normal goods and vice versa.
- increase in income leads to decrease in demand for inferior goods and vice versa.
- The demand for necessary goods increases upto a certain limit with the increase in income and after that limit, the increase in income has no effect on its demand.
- The demand for consumer goods increases with the increase in income.
![]()
Question 18.
Find two difference between Budget time & Budget set?
Answer:
Budget line:
- The combination of two goods that a consumer purchases depend upon the income and price of two goods.
- Budget line is a Locus of different combination of the two goods which the consumer consumes.
Budget set:
- A Budget set is a collection of all Bundles available to a consumer at the Prevailing market price at a given level of income.
- Budget set includes all the Bundles with a total income.
Question 19.
What are the difference between cardinal & ordinal approach to utility analysis?
Answer:
| Cardinal Approach | Ordinal Approach |
| 1. The Cardinal approach is known as utility approach. | 1. Ordinal approach is also known as Indifference approach. |
| 2. The cardinal approach is also collected as traditional and Marshallian approach. | 2. The ordianl approach is described as Hicksian approach. |
| 3. According to cardinal concept utility is quantitatively measureable | 3. According to ordinal concept, utility cannot be Quantitatinely measurable. |
| 4. In cardinal utility concept is is possible to measure utilites in cardinal numbers such as 1, 2, 3, 4 etc. | 4. And in ordinal utilites concept, utility connot be measured by numbers, but utility can be expressed by giving ranks or order such as I, II, III, IV etc. |
Long Answer Type Questions
Question 1.
Explain the concept of ‘Budget Bne’and ‘Budget set’ with an example?
Answer:
Budget line:
The budget line is the combination of two goods that a consumer purchases depends upon the income (consumer budget) and the prices of the two goods.
Ex: Let us understand the concept of Budget with help of example.
Suppose, a consumer has an income of Rs. 20 and wants to spend it on two commodities x and y which are
Priced at the 10 each Now the consumer has three options to spend the entire income.
- Buy 2 units of x
- Buy 2 units of y
- buy 1 unit of x and 1 unit of y.
Budget Set:
Is a collection of all bundles available to a consumer at Prevailing market price at a given level of income. Budget set is also known as ‘opportunity set’
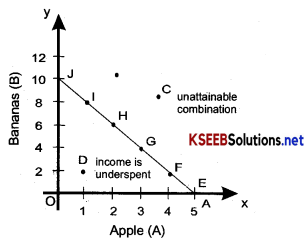
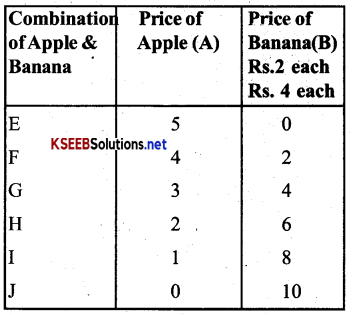
Ex: Suppose a consumer has a budget of Rs. 20 to be spent on two commodities. Apple (A) and Banana (B). If apples are priced as Rs. 4 each and Bananas at Rs. 2 each, then the consumer can determine the various Options which form the budget line.
1. The possible options of spending income of Rs. 20 are given below
![]()
Question 2.
Explain any five properties of Indifference curves?
Answer:
The properties of indifference curve:
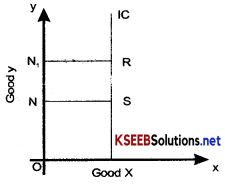
1. A higher Indifference curve represents a higher level of satisfaction than a lower Indifference curve
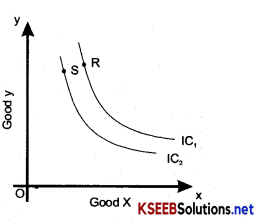
2. An Indifference y curve cannot be a downward sloping straight line. If it so as shown in the diagram then the MRS will remain constant. This is unrealistic.
3. An Indifference curve cannot be a vertical line or horizontal line. If is more so, it would be contrary to the principles of the Indifference curve.
4. An Indifference curve must always be convex to the origin and not concave.
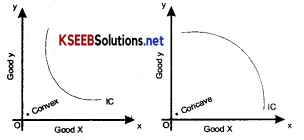
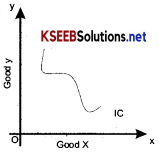
5. An Indifference curve cannot have a bulge as below.
If an Indifference curve has a bulge as shown in the diagram, it is clear f that the MRS is not diminishing constantly. It means the consumer is ° behaving erratically.
Question 3.
Explain the law of diminishing marginal utility with schedule and diagram?
Answer:
The Law of diminishing marginal utility simply tells us that we obtain less and less marginal utility from the sucessive units of a commodity as we consume more and more of it.
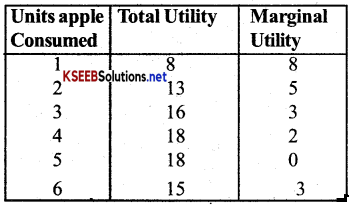
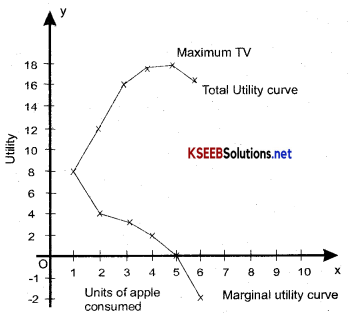
In the diagram units of apples consumed are measured along OX axis and the utility along OY axis.
As it is clear in the diagram when the consumer consumes first apple, he gets a total utilities of 8 units and the marginal utility also become 08 units. The second apple gives him 5 units of utility which is less than that of the first apple. If he continues to the 3rd and 4th units of apples the marginal utility diminishes to 3 and 4 units respectively. When he consumes the fifth (5th) his total utility remains at 18 units (which is maximum) and the marginal utilitiey becomes zero (0). If he consumes the sixth (6th) apple, the marginal utility becomes negative and total utility starts diminishing.
Question 4.
Explain the Indifference curve and Indifference map with help of schedule and diagrams.
Answer:
Indifference curve shows the different combinations of two commodities in which consumers get equal satisfaction.
It explains consumer behaviour in terms of his Preferences or rankings for different combinations of two goods, say x and y. An indifference curve is drawn from the indifference schedule of consumer. The latter showes the various combinations of the two commodities such that the consumer is indiffrent to those combinations. “An indifference schedule is a list of combinations of two commodities, preferring none of any other”
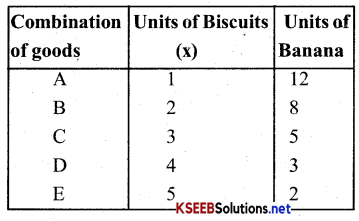
In the diagram Biscuits is represented on the x-axis. And Banana’s on the y axis. It can be understood that when the number of biscuits increase, the number of banana’s will decrease so that the level of satisfaction is the same for all the combinations therefore, you are different between the combinations A, B, C, D & E.
Indifference Map:
A group or a set of Indifference Map curves for two commodities showing different levels of satisfaction is called Indifference Map.
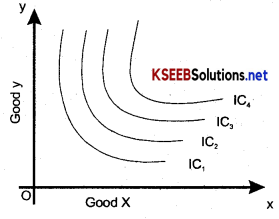
In the Indifference Map, it should be clearly understood that a higher indifference curve denotes a higher level of satisfaction and a lower indifference curve represents lower level of satisfaction.
In the diagram, IC4 gives a higher level of satisfaction compared to IC3, IC2, IC1 and at the same time IC1 yields lower level of satisfaction Compared IC2, IC3, IC4
![]()
Question 5.
Explain consumer’s equilibrium through indifference curve analysis?
Answer:
An indifference depicts the choice and priority of a consumer. The budget line shows the ability to pay choice and priority can be achieved only when there is affordability. Therefore, In order to achieve consumer’s equilibrium that maximises, utility. We have to determine the combination of goods that can be purchased within a certain amount of budget.
The consumer’s equilibrium can be illustrated with help of a diagram.
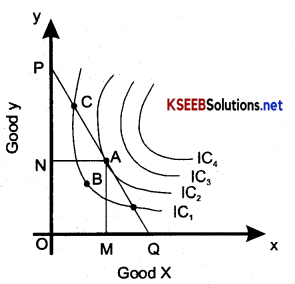
In the diagram there are four indifference curves IC1, IC2, IC3 and IC4 and a budget line PQ. Which of the points from A to D is and optimal utility maximizing optimum choice willbe.
1. Suppose point B is optimal?
No. Ais better than B since A is on a higher indifference curve. The consumer has to choose A, since ‘A’ on the Budget line.
2. Suppose point ‘C’ is optimal?
No. Because, Both B and G are on the same indifference curve, therefore, B is as good as c. However ‘A’ Better than ‘B’ and ‘C’
3. Suppose point ‘D ’ is optimal?
No. ‘D’ is on a higher indifference curve than any of other Baskets, Ato C. It, therefore produces the highest level of utility. However, the consumer cannot ‘D’ since it lives outside the budget line therefore, D is not an optimal choice.
4. Suppose point ‘A’ is optimal?
Yes. ‘A’ is the only combination that gives the maximum utility. All other points that lie on or below the budget line give higher or lower levels of utility. At point A, the indifference curve just touches the budget line and equilibrium is achieved at that point.
Thus we can say that the consumer is in the equilibrium position when the price line is target to the indifference curve.
Question 6.
Explain the law of demand with the help of demand Schedule and demand curve?
Answer:
The Law of demand states that when the price of a good decrease, the demand for it increases and when the price increases, the demand for the good decreases.
Demand Schedule:
The law of demand can be explained with the help of a demanding schedule.
| Price per unit in Rs. | Quantity demanded in units. |
| 1 | 10 |
| 2 | 8 |
| 3 | 6 |
| 4 | 4 |
| 5 | 2 |
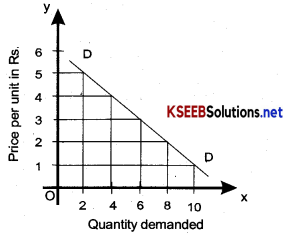
In the diagram the price in rupees is represented on Y-axis and the Qantity demanded on (x) Axis. If the price of orange is Rs. 1 per unit, 10 oranges are demanded. If the price of orange increases Rs.2, Rs.3, Rs. 4 and Rs. 5 per unit the number of oranges demanded decreases to 8, 6, 4 and 2 units respectively. Thus this proves that there is an inverse relation between the price and quantity demanded
Question 7.
Classify the price Elasticity of demand and explain them with diagram?
Answer:
The degree of price elasticity of demand varies from one good to another on the basis of this, the price elasticity of demand can be calssified as follows.
1. Perfectly elastic demand
It refers to a situation where the slightest change in the price of a commodity leads to infinite or rapid change in quantity demanded. In this case
Ep = \(\frac{\infty}{0}\) = ∞ (∞ is an infinite sign)
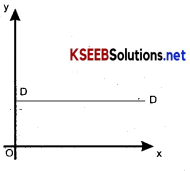
Perfectly inelastic demand:
Demand is said to be perfectly inelastic when a substantial change in the price does not lead to any change in demand. In this case. Ped = 0 or Ep = 0 Here the demand curve (DD) is vertical.
Relatively elastic demand:
Demand for a commodity? is relatively elastic when a change in price If ads to more proportionate change in quantity demanded.
ex: If the price Changes by 10 percent, then the change in demand is 15 percent.
Here the .demand curve (DD) is flatter.
Relatively inelastic demand
Demand for a commodity is relatively inelastic when a change in price causes a less than proportionate change in the quantity demanded in this Ped < 1.
Ex: When a 10, per cent change in price causes a per cent change in demand
In this case Ped < 1
Unitary elastic demand
Price elasticity of demand is unity when the change in demand is exactly proportionate to the change in price.
In this case Ped = 1
Ex: When a 10 per change in price causes a 10 percent in demand. Here the demand curve (DD) takes the shape of a rectangular hyperbola.
Exercises
Question 1.
What do you mean by the budget set of a consumer?
Answer:
The budget set of a consumer means the collection of all bundles that consumers in an economy can buy with their incomes at the prevailing market price.
![]()
Question 2.
What is budget line
Answer:
The Budget line shows the particular combination of two goods that a consumer can buy with a given money income when price is constant.
Question 3.
Explain why the budget line is downward sloping?
Answer:
The budget line is downward sloping because if the consumer wants to consume an extra unit of one commodity, he has to give up some amount of other commodity.
Question 4.
A Consumer wants to consume two goods. The price of two goods are Rs. 4 and Rs. 5 respectively. The consumers income is Rs. 20.
1. Write down the equation of the budget line.
2. How much good – 1, can the consumer consume if she spends her entire income on that good?
3. How much good-2, can she consume if she spends her entire income on that good?
4. What is the slope of the budget line which is as follows.
Answer:
1. The equation of the budget line is as follows
P1 x1 + P2 x2 = M
Solving the above exaple with the equation:
4x1 + 5x2 = 20
Price of X1 commodity → 4 Rs.
Price of X2 commodity → 5 Rs.
The Income of consumer (M) → 20Rs.
2. M = P1x1 + P2x2
20 = 4x1 +0
4x1 = 20
x1 = \(\frac{20}{4}\) = 5 units
The consumer can consume 5 units of commodity-1 if she spends her entire income on that good.
3. M = P1x1 + P2 x2
20 = 0 + 5x2
5x2 = 20
x2 = \(\frac{20}{5}\) = 4 units
The Consumer can consume 4 units of commodity 2 if she spends his entire income on that good.
4. The slope of the budget line is
M = \(\frac{P_{1}}{P_{2}}=\frac{4}{5}\) = 0.8
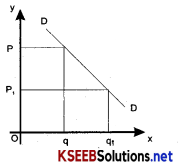
Question 5.
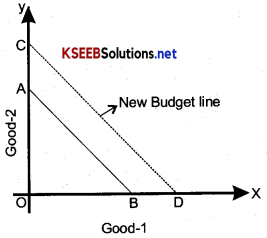
How does the budget line change if the consumer’s income increases to Rs. 40, but the prices remain unchanged?
Answer:
The budget line will shift outward i.e. to its right as shown in the diagram. The dotted line is the new budget line.
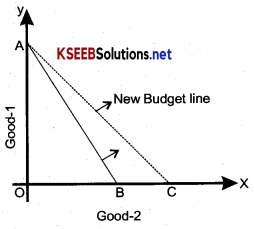
Question 6.
How does the budget line change if the Price of good -2 increases by a rupee-1 but the price of good -1 and the consumer’s income remain unchanged?
Answer:
There will be an outward shift of budget line meeting OX – axis due to the fall in the Prices of good -2 as shown in the diagram.
Question 7.
What happens to the budget set if the prices of both goods as well as the income doubles.
Answer:
There will be no change in the budget set if the prices of both goods as well as the income doubles.
![]()
Question 8.
Suppose a consumer can afford to buy 6 units of goods-1 and 8 units of good – 2, if he spends his entire income. The prices of the two goods are Rs. 6 and Rs. 8 respectively. How much is the consumer’s income?
Answer:
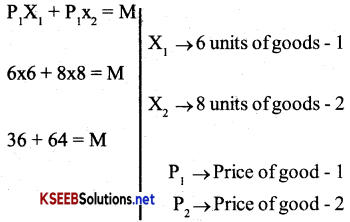
Hence consumer’s income is Rs. 100.
Question 9.
Suppose a consumer wants to consume two goods which are available only in the interger units. The two goods are equally priced at Rs. 10 and the consumer’s income is Rs. 40.
(i) Write down all the bundles that are available to the consumer.
(ii) Among the bundles that are available to the consumes identify those that cost have exactly Rs. 40.
Answer:
1. All bundles available to the consumers are as follows:
(0,0), (0,1), (0,2), (0,3), (0,4), (1,0), (1,1), (1,2), (1,3), (2,0), (2,1), (2,2), (3,0), (3,1) and (4,0)
2. Bundles which cost exactly Rs. 40 are as follows:
(0,4), (1,3), (2,2), (3,1) & (4,0)
Question 10.
What do you mean by monotonic preferences?
Answer:
It means that a rational consumer always prefers a commodity as it offers him a higher level of satisfaction.
A consumer’s preferences are monotonic only if it is between any two bundles, the consumer prefers the bundle which has more of at least one of the goods and no less of the other good as compared to the other bundle.
Question 11.
If a consumer has monotonic preferences can she be indifferent between the bundles (10,8) and (8,6)
Answer:
No, she cannot.
Question 12.
Suppose a consumer’s preferences are monotonic. What can you say about her preference ranking over the bundles (10,10), (10,9) and (9,9)
Answer:
| Bundles | Ranking over the bundles |
| (10,10) | Best |
| (10,9) | Second |
| (9,9) | Third |
Question 13.
Suppose your friend is indifferent between the bundles (5,6) and (6,6). Are the preferences of your friend monotonic?
Answer:
No.
Question 14.
Suppose there are two consumers in the market for a good and their demand functions are as follows:
d1 (p)=20-p, for any price less than or equal to 15, and d1(p)=0 at any price greater than 15.
d (p)=30-2p for any price less than or equal to 15, and d^p)^) at any Price greater than 15. Find out the market demand Function.
Answer:
A – Consumer – d1(P) = 20 – P → when P< 15,
d1(P) = 0 when P>15 ………..(1)
B – Consumer – d2(P) = 30 – 2P → when P<15, d1 – (P) = 0 when P >15 ………(2)
Market demand – dm = 50 – 3P, is the market demand we get by adding both equations (i) & (ii).
![]()
Question 15.
Suppose there are 20 consumers a good and they have identical demand functions. d(p) = 10 – 3 p for any price less than or 10 equal \(\frac{10}{3}\) and d1(p) = 0 at any greater 10 than \(\frac{10}{3}\) What is market demand function?
Answer:
dm(p)= (10-3p) 20 for any price less than 10 or equal to \(\frac{10}{3}\) and d1(p) = 0 for any price greater \(\frac{10}{3}\).
Question 16.
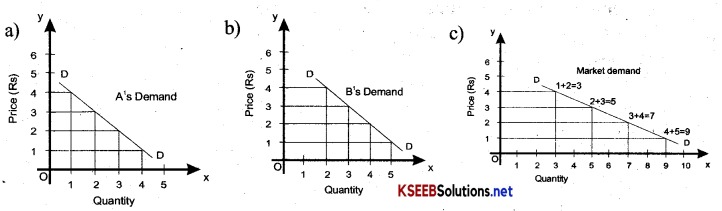
Consider a market where there are just two consumers and suppose their demands for goods are as follows, calculate the market demand for the good.
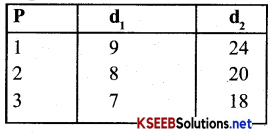

The market demand for the good:
Answer:
d1 + d2 = dm
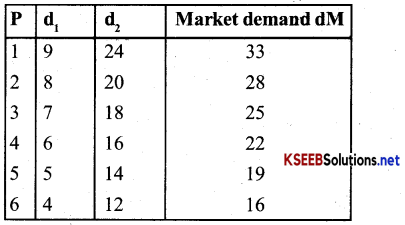
Question 17.
What do you mean by a normal good?
Answer:
Normal goods are those goods whose demand increases with increase in income and vice versa.
Question 18.
What do you mean by an inferior good? Give Some examples?
Answer:
A good for which the demand decreases with an increase in the income of the consumer is called an inferior good.
Ex: Pearl millet (sale), finger millet (ragi)
etc.
Question 19.
What do you mean by substitute goods? Give example of two goods which are substitutes of each other V
Answer:
Goods that are used as alternatives to satisfy a particular need are called substitute goods.
Ex : Goods like Tea & coffee, Diesel & gas etc.
OR
When the price of a good increase, the demand for its substitute good also increases.
![]()
Question 20.
What do you mean by complements? Give examples of two goods which are complements to each other?
Answer:
Goods which are consumed together to satisfy a want are called complementary goods.
or
When the Price of a good increases, the demand for its complementary good decreases.
Ex: Scooter & Petrol, Tea & sugar, Pen & ink etc.
Question 21.
Explain Price elasticity of demand?
Answer:
Price eleasticity of demand refers to the change in quantity demanded due to the change in the Price of commodity.
It can be calculated by the formula.
ped = \(\frac{\text { Percentage change in demand }}{\text { Percentage change in price }}\)
or
Ped = \(\frac{\Delta q}{\Delta P} × \frac{P}{q}\)
Question 22.
Consider the demand curve for a good. At Price Rs. 4 the demand for the good is 25. Suppose price of the good increases to Rs. 5 and as a result the demand for the goods falls to 20 units. Calculate price elasticity.
Answer:
| Price | Quantity demanded units |
| 4 | 25 |
| 5 | 20 |
ΔP = 5 – 4 = 1Rs.
Δ q = 25 – 20 = 5 units
P = 4 Rs
q = 25
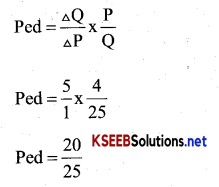
Ped = 0.8
Question 23.
Consider the demand curve D (p)= 10-3p. What is the elasticity at price \(\frac{5}{3}\)
Answer:
We know that a linear demand curve is expressed as
q = a – b P
Here D = 10 – 3 P
Hence, a = 10
b = 3
P = \(\frac{5}{3}\)
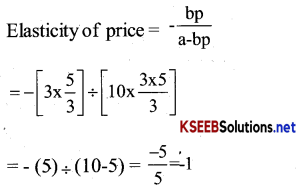
Hence, eleasticity of Price = -1
Question 24.
Suppose the Price Elasticity of Demand for a good is 1.2. If there is a 5% increase in the price of the good, by what percentage will the demand for the good go down?
Answer:
Ped = \(\frac{\text { Percentage change in demand }}{\text { Percentage change in price }}\)
Substituting the value we get,
0.2 = \(\frac{\text { Percentage change in quantity demand }}{5}\)
or, Percentage change in quantity demanded . = 0.2 × 5 = 1 (one)
Question 25.
Suppose the Price elasticity of demand for a good is -0.2. How will the expenditure on the good be affected if there is 10% increase in the price of the goods?
Answer:
Here the PEd = 0.2, i.e. Ed < 1. If Ed < -1 then (1 + Ed)< 0 and hence E has the same sign as Δ P Here Δ P has plus sign, so Δ E will have plus sign. Hence, expenditure will increase.
Question 26.
Suppose there was a 4% decrease in the price of a good and as a result. The expenditure on the good increased by 2%. What can you say about the elasticity of demand?
Answer:
Here, change in price (decrease) and change in expenditure is (increase) go in the opposite direction. Hence Ed > 1.