Karnataka 2nd PUC Economics Important Questions Chapter 5 Market Equilibrium
Very Short Answer Type Questions
Question 1.
What is price ceiling?
Answer:
It means maximum price of a commodity fixed by the government.
Question 2.
Give two eamples for price ceiling imposed in India?
Answer:
The two examples for price ceiling imposed in India are:
- Wheat
- Rice
- Kerosene oil etc.
Question 3.
What will be the result of imposing price ceiling?
Answer:
It gives rise to excess demand or shortage of a commodity.
Question 4.
What is price floor?
Answer:
It means minimum price fixed by the government for a commodity in market.
![]()
Question 5.
What will be the result of imposing price flor?
Answer:
More supply and less demand i.e excess supply or abundance of supply of commodity.
Long Answer Type Questions
Question 1.
How is the equilibrium price and equilibrium quantity of a normal commodity affected by an increase in the income of its buyers? Explain with the help of diagram.
(OR)
How does an increase in demand of a commodity affect its equilibrium price and equilibrium quantity? Explain with the help of a diagram.
Answer:
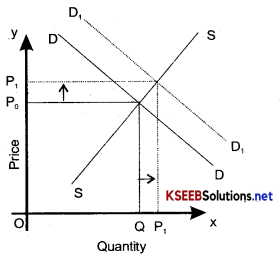
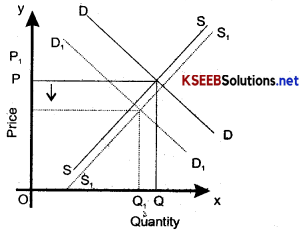
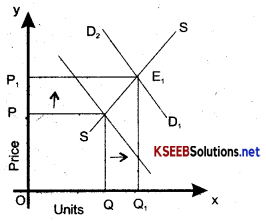
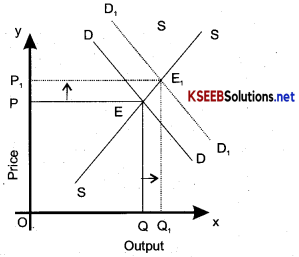
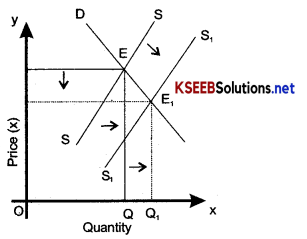
Effect of increase in the income of the buyers on the equilibrium price and equili brium quantity of a normal commodity:
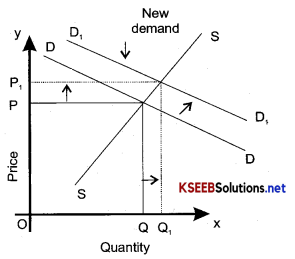
rightward shift of demand curve as show in the diagram. The rightward shifting of demand curve will raise the equilibrium price and the quantity. In the figure DD and SS are initial demand and supply curve. The increase in income causes shift in the entire demand curve to the right to the new positions while the supply curve remains constant. It will be observed from figure that with the shift in demand curve on at the old price OP excess demand equal to EQA has emerged.This excess demand of goods exerts upward pressure on price. This will result in rise in price to OP1 where again quantity demanded equals quantity supplied and two market equilibrium I is attained and excess of demand is eliminated.
Question 2.
At a given price of a commodity, there is excess demand. Is the price an equilibrium price? If not, how will the equilibrium price be reached? Use diagram.
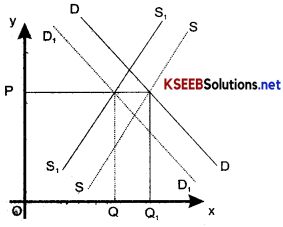
Answer:
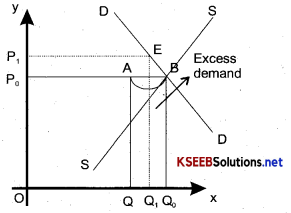
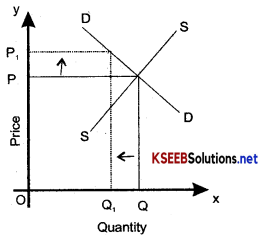
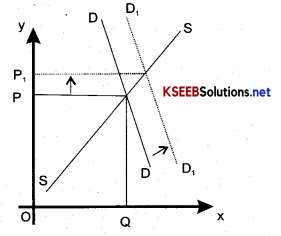
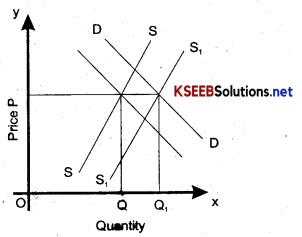
The price with excess demand: The price with excess demand cannot be called as on equihbrium price. Equilibrium price is situation of zero excess and demand and zero excess supply. In the diagram, DD is the demand curve, and SS is supply curve. OP1 is the market price. At this price, the supply is OQ and the demand is OQ1 It means the consumers want more than what the producers are willing to supply (i.e. no excess demand and no excess supply). Excess demand will create competition among the buyers and push the price up. The price will go on increasing till excess demand becomes zero. Finally the price reaches OP. OP1 is the equilibrium price. At this price demanded is equal to supply. Both are equal to OQ0.
![]()
Question 3.
At a given price of the commodity, there is excess supply. Is it equilibrium price? If not how will the equilibrium price be reached? Use diagram.
Answer:
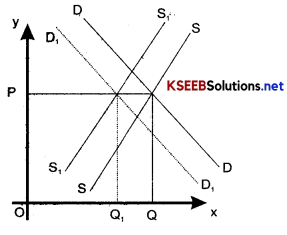
The price with excess supply: The price with excess supply cannot be called as an equihbrium price. Equilibrium price is a situation of zero excess supply and zero excess demand.
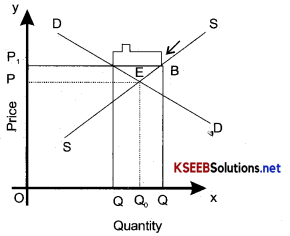
In the diagram DD is the demand curve and SS is the supply curve. OP1 is the market price, the supply in OQ and demand is OQ1. It means that the consumers want less than what the products are willing to supply. There is excess supply equal to AB or Q1Q. So given price is not the equilibrium price as at equilibrium price supply is equal to demand (i.e. no excess demand no excess supply). Excess supply will create competition among the suppliers and push down the price. The price will go on decreasing till excess supply becomes zero. Finally, the process reaches OP. OP is the equilibrium price. At this price supply is equal to demand i.e., both demand and supply are equal.
Question 4.
How will an increase in the income of the buyers of ah inferior goods affect its equilibrium quantity? Explain with help of a diagram.
OR
What happens to an equilibrium price and the equilibrium quantity of commodity sold in market when demand for it decreases (demand curve shifts downwards) while the supply curve remained unchanged.
Answer:
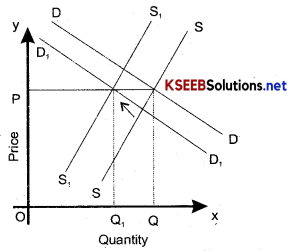
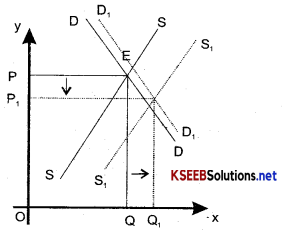
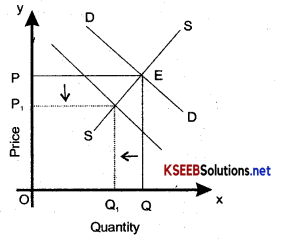
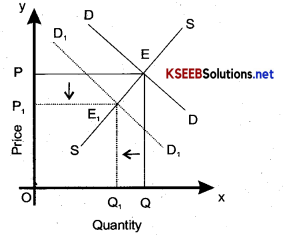
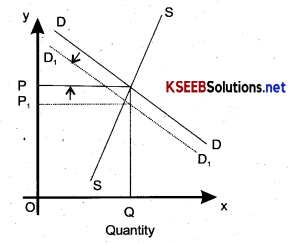
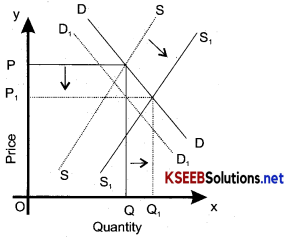
When the income of the buyer of inferior goods rises the demand for inferior goods M. In this case, the demand curve shifts leftwards or downwards. This is graphically shown in the figure where original demand curve D0D0 interest the supply curve SS at point EQ and determines equilibrium price equal to OPQ and equilibrium quantity OQ. Now with the increase in the income of the buyer, the demand curve for inferior goods will shift to left and the new demand curve will be D1D1.
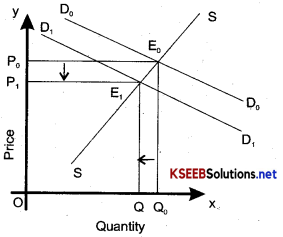
The new equilibrium between demand and supply is attained at price OP1 and quantity OQ1 which is lower than initial equilibrium price OPQ price and quantity. With the decrease in demand supply curve remaining unchanged at the original price OPQ, the surplus E0E1 of the quantity supplied over the quantity demanded emerges which exerts downward pressure on price. The sellers who cannot sell at the original price will make offers to sell inferior goods at a lower price. As a result, price will fall. As price falls, the quantity of supply of inferior goods is reduced. At the new price OP2 the quantity demanded and surplus is eliminated.
Question 5.
What will be the impact on market price and the quantity exchanged when:
(a) there is a rightward shift in the demand curve;
Answer:
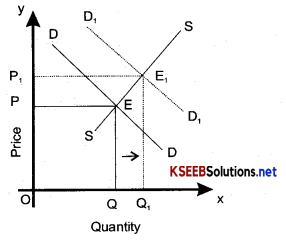
Due to a rightward shift in the demand curve the market – price, as well as the quantity exchanged, will increase as shown in the following diagram.
(b) the demand curve is perfectly elastic and the supply curve shifts out;
Answer:
The demand curve being perfectly elastic, shifting out of the supply curve right (or left) leads to an increase (or decrease) in the quantity exchanged and no change in market price as shown below in the diagram.
(c) both the demand and supply decrease in the same proportion?
Answer:
The market price will be the same but the quantity exchanged will decrease as shown below in the diagram.
Question 6.
Explain price support.
Answer:
Price support has been laid on the price of such commodities as are covered under the price support measures, producers of these commodities need not set at price lower than the floor price fixed by the Govt.
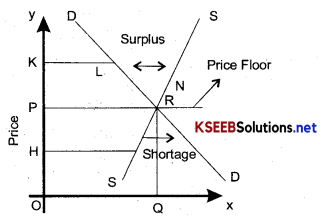
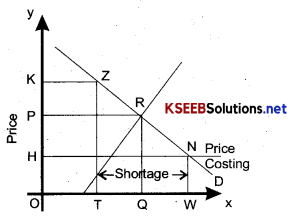
In the figure, R is the equilibrium point determined by the intersection of demand and supply curves, OQ quantity is being supplied and demanded at OP price.
Suppose, the government decides to improve price support as already stated take the form of floor on price, floors could be fixed at a price
- lower than the equilibrium price, say at OH,
- equal to the equilibrium price, OP and
- more than equilibrium price say at OK
1. If floor is less than equilibrium, it will have no effect on the market. At a lower price say OH, HZ quantity will be supplied the considers on the other hand, would be willing to pay higher price. The price will move upwards towards the equilibrium level.
2. If floor price equals to the equilibrium price OP, it will leave the market unaffected.
3. If floor price is more than the equilibrium price, it will need further attention. Suppose in fig, the government impose the price floor at OK unit. The equilibrium price OP would no longer be legally obtainable. Price must be raised to OK At the higher price OK quantity demanded will contract to KL. But at this price suppliers will be ready to supply KN quantity As a result, the surplus will emerge, surplus is shown by the segment ZN. This surplus may be purchased by the government.
We reach the following conclusions about the effect of price support in a free market.
A consequence of price support:
Composition of floor price above equilibrium price will have following implications:
1. Surplus:
The quantity actually bought and supplied will shrink as a direct consequence price support, as a result, large chunk of producer’s stocks will remain unutilised.
2. Subsidies:
To offset the loss to the consumers the govt may undertake to subsidies the product. By subsidy, we mean that the government purchases the product at the support price and sells the product to consumer below its costs of procurement. The difference between cost and price is borne by the government.
Question 7.
Show the impact of price control and rationing on demand and supply
Answer:
The government has imposed price controls on number of commodities (eg. petrol, kerosene, etc) price control means that a ceiling has been imposed on the prices of such commodities as are covered under the price control measures. Producers of these commodities cannot charge prices higher the ceiling price fixed by government. Fixation of ceilings on price means that the free operation of those forces of demand and supply is being interfered with. Let us see what will happen in such situation.
In figure below, DD and SS are the original demand and supply curves respectively for a commodity. K is the equilibrium point, corresponding to which OQ quantity is being demanded and supplied at the price OP per unit.
suppose, the government decides to interfere with the free operation of the market forces i.e, it decides to impose price controls. Price control, take the form of ceiling on prices, ceiling could be fixed at price:
- higher than the equilibrium price, say at OK
- Equal to the equilibrium price, i.e. OP and
- Less than the equilibrium price, say at OH.
1. If ceiling price is more than the equilibrium price, it will have no effect on the market-At a higher price, say OK, OT quantity of commodity will be demanded. The suppliers, on the other hand, would be waiting in the winds to supply more than the quantity being presently demanded. There will be tendency for the price to fall down to the equilibrium.
2. If ceiling price equals the equilibrium price OP, it will leave a market unaffected.
3. If ceiling price is less than the equilibrium price, it will create conditions which need our fiuther attention. Suppose, in the figure above the government impose ceiling at OH price per unit. The equilibrium price OP, would no longer be logically obtainable. Price must be reduced from OP to OH. At the lower price OH quantity demanded will expand to NH or O W. But at this reduced price, supplies will ready to supply only HL or OT quantity of goods.
As a result, a shortage of this commodity will emerge. This shortage is being represented by the line segment LN.
We reach the folio whig conclusions about the affect of price control in a free market.
1. Shortages:
The quantity actually sold and brought in the market will become less and hence price, will rise and many consumers will go unsatisfied.
2. Problem of allocation of limited supplies among large number of consumers:
In case of shortage of commodities, the scarce product may be disturbed on the basis of first come first served.
To avoid the problem of shortage, the government generally adopt price control with distribution controls. The most effective form of distribution control is rationing. Rationing is ceiling imposed on the quantity which can be bought and consumed by the consumer.
3. Black marketing:
Black marketing is a direct consequence of price controls. Black marketing implies a situation in which the controlled commodity is sold unlawfully below the desk, at a price higher than the lawfully enforced ceiling price.
![]()
Question 8.
Equilibrium price may or may not change with shifts in both demand and supply curves. Comment.
OR
Market for a demand is in equilibrium. There is simultaneous increase both in demand and supply of the good. Explain its effect on market price.
OR
Market for a good is in equilibrium. There h simultaneous decrease in demand and supply of the good. Explain its effect on market price.
Answer:
With shifts in both demand and supply curves, equilibrium price many change or may not change. It depends upon the proportion by which these two curves change. First shall discuss these situations under which equilibrium price change and then the situation under which equilibrium price change and than the situation under which equilibrium price does not change.
Case: 1: Equilibrium price changes:
1. Equilibrium price changes when increase in supply is by a higher proportion as compared to the increase in demand show in the diagram.
2. The equilibrium price increases when increases when the increase in supply is by a smaller proportion as compared to the increase in demand as shown below in the diagram.
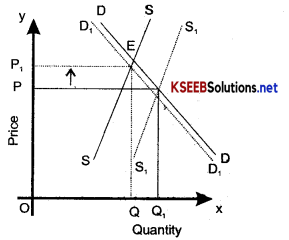
3. The equilibrium price increases when both demand and supply decreases but supply decreases by a higher proportion as shown below in the diagram.
From the diagram, we come to know that the price increases from OP to OP1
4. Equilibrium price decreases when both demand and supply decreases but a decrease in demand is more than decrease
From the diagram, we come to know that the equilibrium price decreases from OP to OP1
Case: 2
No change in equilibrium price.
1. The equilibrium price does not change if both the demand and supply increase by the same proportion as shown below in the diagram:
From the diagram we come to know that equilibrium price remained unchanged,
2. The equilibrium price does not change when both demand and supply decrease, by same proportion as shown below in the diagram:
Question 9.
Explain monopoly firm’s equilibrium with the help of marginal revenue and marginal cost approach.
Answer:
Monopoly firm’s equilibrium with the help of MR and MC approach: There are two necessary conditions that must be fulfilled for a firm to be in equilibrium are:
- MC = MR
- MC should cut MR from below
In the figure, the Average Cost (AC) Average Variable Cost (AVC) and Marginal Cost (MC) curves are drawn along with the demand (Average revenle) wive and marginal revenue curve.
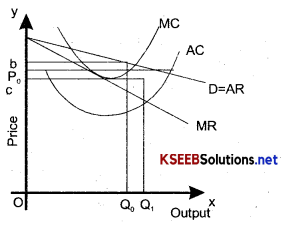
Form the diagram we come to know that at quantity level below q(|. The level of MR is higher than the level of MC. This means that the increase in total revenue from selling an extra unit of the commodity is greater than the increase in total cost for producing the additional unit.
This implies that an additional unit of output would create additional profits since change in profit is the change in TR, change in TC. Therefore if the firm producing at a level of output since that would add to its profits. As long as the MR curve lies above the MC curve, the firm would increase its output. This process comes to a halt when the firm reaches an output level of qt since at this MR equal to MC and increasing output would provides no increase in profits.
Question 10.
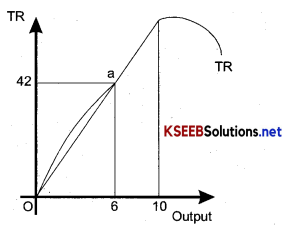
Calculate the value of AR from the TR curve graphically
Answer:
In order to calculate (find) the value of AR from the TR curve for any level of quantity sold, construct a figure as given below.
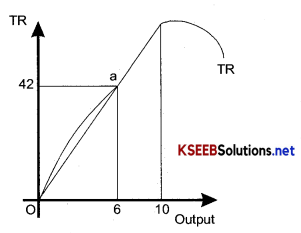
Suppose we have to calculate the value of AR of 6 units sold. In this case draw a vertical line passing through the value 6 on the horizontal axis. This will cut the TR curve at the point marked ‘a’ at a height equal to 42. The scope of this ray from the orgin to a point or the TR provides the value of Ar. The slope of this ray is equal to 7. Therefore Ar has the value of 7.
Question 11.
From the data given below, calculate the value of AR of 6 units arithmetically and geometrically / graphically.
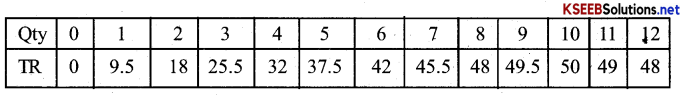
Answer:
Calculation of AR arithmetically
AR = \(\frac{\mathrm{TR}}{\text { Units }}=\frac{42}{6}\) = 7
![]()
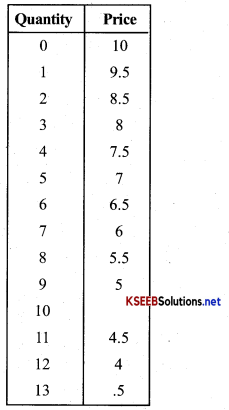
Question 12.
Demand function is iven by the equation q = 20 – 2P
Make prices and revenue table with the values of q from 0 to 13.
Answer:
Substituting q = 20 – 2p
or
2p = 20 – q
or
P = 10 – 0.5
Substituting different values of q from 0 to 13 we get the prices from 0 to 3.5. These are shown in the q and p column
Question 13.
Explain monopoly firm’s equilibrium with that help of total curves.
OR
Explain a monopoly firm’s equilibrium with the help of total cost and total revenue curves.
Answer:
Monopoly firm’s equilibrium with the help of total cost and total Revenue curves. A firms will be in equilibrium with when it earns maximum profits. A firm will obtain maximum profits at the level of output where the vertical distance between total revenue and total cost ins maximum. It has been explain below the help of following diagram.
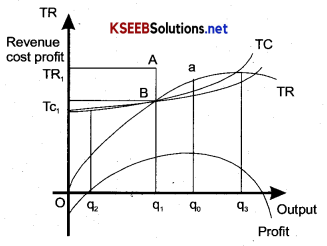
In the fig. output is measured on X-axis while cost and revenue on X-axis TR and TC and the total revenue curve and total cost curve responsibility. The profits received by the firm figure, we are that equals the total Revenue mihus the total cost in the figure, we see that if quantity q is one produced that total revenue is TR, and the cost is TC1.
The difference TR1 – TC1 is the profit receives the same is depicted by the length of the Line segment AB i.e. The vertical difference between TR and TC curves at q. Level of output. It should be clear that this vertical distance changes for different levels of output. When output level is different levels of output when output level is les than th q2 The TC curve lies above the TR cure i.e. TC is greater than TR and therefore profit negative and the firm makes lossess.
• The same situation exists for output level greater than q3 Hence the firm can make positive profits only at the output level between q2 and q3 where TR curve tees above the T curve. The monopoly firm will be chosen that level of output which maximums is profit. This would be level of output for which the verticals.
Forms of Market and price determination distance between Tr and TC is maximum and TR is above the TC i.e, the TR – TC is maximum. This occurs the level of output q. It is noticed that the profit curve has its maximum value at the level of output q0.
The price at which this output is sold is the price consumers are willing to pay for this q0. Quantity of the commodity. So the monopoly firm will charge the price corresponding to the quantity level q0 on the demand curve.
Question 14.
Write down the features of oligopoly.
Answer:
Features of oligopoly: Following are main feature of oligopoly.
1. Few sellers: The numbers of sellers is the very less in oligopoly. The number of sellers is so small that every seller controls a large share of total market supply by his activities. He also influence other sellers activities and price of the commodity.
2. Nature of products: Products in an oligopoly are may be either homogenous or differentiated.
3. Interdependence: The firms in an oligopoly are interdependent in decision making, This is due to fact that any change in price-output product etc by a firm will have a direct effect on the fortune of its rivals. The rival firms will the react by changing there own prices, output, products as the case may be. It is clear that while taking any decision, a firm must consider not only the market demand for the industries product but also the reactions of the other firms in the industry to any action or decision it may takes.
4. Importance of advertising and selling cost: Due to server competition and interdependence of the firm various sales promotional technique are used in Oligopoly. Selling cost are more important in this type of market.
5. Entry barriers: There are many entry barriers in Oligopoly some of them are patents requirements of large capital control or over curial raw materials etc.
6. Non-price competition: Firms under Oligopoly try to avoid price compeition for the fear of price war. They use other methods like advertis in better services to customers etc to compete with each other.
7. Price – rigidity: Under Oligopoly the firms follow the policy of the price rigidity. Price rigidity refers to situation in which price tends to slay fixed irrespective of changes in demand and supply conditions.
8. Kinked demand curve: Under Oligopoly, the demand curve is indeterminate. No firm can be certain of demand for its product due to unsure reaction of rival firm.
9. Types of Oligopoly: Oligopoly is brodly divided into two types:
- Collusive Oligopoly &
- Non-collusive Oligopoly.
Under collusive oligopoly firms collude to forma cartel. The cartel follows common phases relating to price, outputs, profit maximisation and distribution of products.
Question 15.
Distinguish between collusive and non – collusive Oligopoly. Explain how the Oligopoly firms are interdependent in taking price and output decisions. Difference between collusive and non – collusive Oligopoly:
Answer:
There are two types of Oligopoly: Collusive and non-collusive. In collusive Oligopoly, the firms (which are few) decide to avoid competition through a formal agreement. They collude to form a cartel. They fix for themselves output quota and market price. Sometimes a leading firm in the market is accepted by cartel as a price leader.
Interdependence in taking price and output decisions:
In an Oligopoly, there is a lot of interdependence in taking price and output devisions. The reason is that number of firms in Oligopoly is a few. Any change in price, output, product etc. by any firm will have a direct effect on the fortune of its rivals. Hence a monopolist firm must consider not only the market demand for the industry product but also the reactions of the other firms in the industry to any action of decision it may take.
Exercises
Question 1.
Explain Market equilibrium.
OR
Define equilibrium. When is a market said to be in equilibrium?
Answer:
Equilibrium: An equilibrium is a situation where there is no tendency for any change. In case of supply and demand, under equilibrium no tendency for any change. In case of supply and demand, under equilibrium, no one has incentive to change either the quantity demanded or supplied and neither there is any tendency for the price to change.
Market equilibrium: Market is said to be equilibrium when the aggregate quantity that all firms wish to sell equals the quantity that all other words market supply equals market demand. Therefore, in equilibrium: y – y8 Where y and ys denote the market demand and market supply of the commodity respectively. The equilibrium market has zero excess demand and zero excess supply situation.
Question 2.
When do we say there is excess demand for a commodity in the market?
Answer:
If at any price, market demand is greater than market supply we say that there is excess demand in the market at that price.
Question 3.
When do we say there is excess supply for a commodity in the market?
Answer:
If at any price market supply is greater than market demand, we say that there is excess supply in the market at the price.
![]()
Question 4.
What will happen if the price prevailing in the market is:
(a) above the equilibrium price
Answer:
In this case, many more firms will enter the market realising that they can earn higher profit here than elsewhere. As a result, at prevailing price, there will be excess supply in the market price and the market price will be equal to the equilibrium price.
(b) below the equilibrium price.
Answer:
In this case many firms who are incurring losses will exit the industry. As a result at prevailing price, there will be excess demand. The excess demand will raise the market price and the market price will be equal to the equilibrium price.
Question 5.
Explain how price is determined in a perfectly competitive market with fixed number of firms.
Or
How is the equilibrium price of a commodity deterimed by demand for supply of a commodity?
Or
Demand and supply are like two blades of pair of scissors’. Explain with reference to equilibrium price.
Answer:
There was a dispute among the earliest economists as to whether it is supply of a good or the demand for and supply of good or the demand for and supply of a commodity are equally important in determining the price of a product.
An eminent English economist Marshall compared the determination of price through demand and supply with the cutting of a piece of paper by the two blades of scissors, the upper and the lower ones. Both the blades are required to do the cutting work. Similarly, both demand and the supply of a good are essential factors for determining its prices.
Equilibrium price: Equilibrium price is the price at which quantity demand of a good equals quantity supplied of it and there is no tendency for the price to rise or fall. At this equilibrium price, the two forces of demand and supply exactly balance each other and therefore there is neither surplus nor shortage of the commodity at this price.
Determination of equilibrium price:
Let us explain how demand for a supply of a commodity determines its equilibrium price. The demand curve of a commodity slope downward. In other words, with an M of price the quantity demanded increases and vice versa. On the other hand, the supply curve of a commodity slopes upward to right. In figure, above the demand curve DD and supply curve SS intersect at point E at which price is OP and quantity demanded and supplied is OQ.
The level of price OP at which demand and supply curve intersect each other will finally come to stay in the market. In other words, the price OP which will come to prevail in market, one at which quantity demanded is equal to quantity supplied. The price OP at which quantity demanded is equal to quantity supplied is therefore equilibrium price because at this price the two forces of demand and supply exactly balance each other. The quantity. OQ of the goods which is purchased and sold at this equilibrium amount. Thus, the intersection of demand and supply curves determines both equilibrium price and quantity.
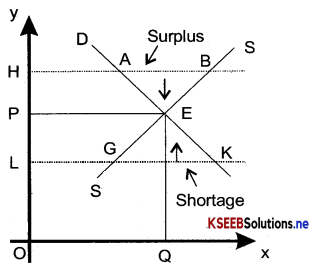
If Price is greater or less than the equilibrium price, the buyers and sellers, whishes would be inconsistennt. Thus, at any price greater or less than the equilibrium price OP either the buyers would demand more than offered by sellers, or the sellers would be ready to supply more than is determined by the buyers. If price of OH, which is greater than the equilibrium price, it will be seen from the figure that the quantity supplied exceeds quantity demanded.
As a result, surplus of the commodity equal to AB Emerges. It means some of the sellers will not be able to sell the amount of goods they want to supply. The unsatisfied sellers would try to dispose of the unsold amount of the goods by bidding price down. The price will go on declining till OP is reached at which the quantity demanded equals quantity supplied.
On the other hand, if price i s fewer than the equilibrium price, say it is OL, the quantity demanded exceeds quantity supplied. As a result, shortage of the commodity equal to GK appears. As a result, some buyers would not be able to obtain the amount of the goods they want to purchase at prevailing price. They will therefore bid up price in their effort to get all that they desire to buy. The price will go on rising till OP is reached where the quantity demanded and quantity supplied are again equal. We thus see that price which we settle down can be neither greater nor less than the equilibrium price. It is an equilibrium price which will finally come to stay in the market.
Question 6.
Suppose the price at which equilibrium is attained above the minimum average cost of the firms constituting the market. Now if we allow for free entry and exit of firms, how will the market price adjust to it?
Answer:
When equilibrium price at equilibrium quantity is more than the minimum average cost: When the price at the equilibrium quantity is more than minimum average cost then there will be abnormal profit. In this case, immediately many more firms will enter the market realising that they can earn higher profit here than elsewhere. As a result at this price there would be excess supply in the market.
This excess supply will lead the firms to lower their prices that they can sell off their entire output. If at this lowered price, the abnormal profit is still positive more firms will enter the market, but the entry will not stop. The entry of new firms will continue as long as the existing firms are earning an abnormal profit of the lower price. Entry of new firms will stop when the price is equal to minimum average cost of each firm.
![]()
Question 7.
At what level of price do the firms in a perfectly competitive market supply when free entry and exit is allowed in the market? How is equilibrium quantity determined in such a market?
Answer:
In perfectly competitive market, the firms will supply at a price which will be equal to minimum average cost. Allowing for entry and exit will imply that the market price will always be equal to the minimum average cost and the equilibrium price will be
P = MinAVC
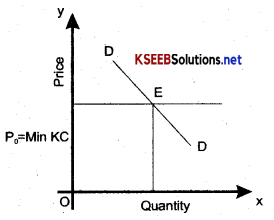
Determination of equilibrium demanded: The equilibrium demanded is determined at that intersection of the market demand curve with the price line P0 = min AC as shown in the diagram.
In diagram, PQ is minimum AC curve DD is the demand curve which intersect Min AC curve at E. Draw EY0 ⊥ to OX axis. So OY° is the equilibrium quantity.
Question 8.
How is the equilibrium number of firms determined in a market when entry and exit is permitted?
Answer:
The equilibrium number of firms in the market is determined by dividing the total quantity demanded and supplied by the firm equation.
n° = \(\frac{\mathrm{y}^{0}}{\mathrm{y}^{0} \mathrm{f}}\)
- n° stands for equilibrium number of firms.
- y° stands quantity demanded and supplied at the equilibrium price.
- y°f stands for quantity supplied by each firm.
Suppose total quantity demanded and supplied at equilibrium price is 180 units and each firm supplies 30 units then equilibrium number of firms will be calculated as under:
n = \(\frac{\mathrm{y}^{0}}{\mathrm{y}^{0} \mathrm{f}}=\frac{180}{30}\) = 6
Question 9.
How are the equilibrium price and quantity affected when income of the consumers
(a) increase?
(b) decrease?
Answer:
Effect of Increase in Income on Equilibrium Price and Quantity
The equilibrium price and quantity will increase with increase in income of the consumer as shown in the diagram.
Effect of decrease in income on equilibrium price and quantity :
With the decrease in income the demand will fall resulting in shifting of demand curve on the left side. The shifting of demand curve to the left side will decrease the equilibrium price and quantity as shown in the diagram are those which are used together. Now the price of the shoes increase resulting with fell in demand for shoes as shown in the diagram
Question 10.
Using supply and demand curves, show how an increase in the price of shoes affects the price of a pair of socks and the number of pairs of socks bought and sold.
Answer:
Effect of increase in price of shoes on the price of socks and the number of socks bought and sold: Shoes and socks are complementary goods. Complementary goods are those which are used together. Now the price of the shoes increase resulting with the in-demand for shoes as shown in the diagram.
With the fell in the demand for shoes, the demand for socks also fall. With the fell in the demand for socks, the price of socks will decrease as shown be tow in the diagram.
![]()
Question 11.
How will a change in price of coffee affect the equilibrium price of tea? Explain the effect on equilibrium quantity also through a diagram.
Answer:
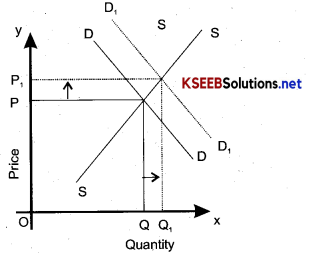
Effect of change in price of coffee on the equilibrium price of tea and quantity: Tea and coffee are substitute goods which can be used in place of each other. There exists a direct relationship between the price and demand of substitute goods. So the increase in price of coffee will increase demand for tea.
The demand curve will shift to right direction as shown above in the diagram. Now new demand curve which intersect supply curve SS at E. Hence new equilibrium price and quantity are OPj and OQj respectively. Hence, the equilibrium price and quantity of tea will rise.
Now suppose the price of the coffee decreases resulting into increase in demand for coffee. It will cause fell in demand for tea. So the demand curve will shift leftwards as shown in the diagram. With the shifting of demand curve towards left, the equilibrium price and quantity will fell as shown in the diagram.
Now DD1 is new demand curve that intersects SS supply curve at E1S0. New equilibrium price and quantity OP1 (Less than OP) and OQ1 (less than OQ). Hence there will be fall in equilibrium price and quantity of tea.
Question 12.
How do the equilibrium price and quantity of a commodity change when price of input used in its production changes?
Answer:
Impact of change in prices of the input used in the production of a commodity on its equilibrium price and quantity:
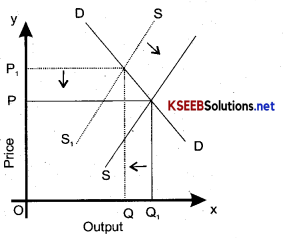
If the price of inputs decrease, the marginal cost would fall. Therefore, the supply curve would shift to the right. With the rightward shifting of the supply curve, the equilibrium price will fall and quantity will increase as shown below in the diagram.
Now the equilibrium price is P1 mislead of P and quantity OQ1 in place of OQ1
On the other hand if the price of inputs increases then the cost of production or marginal cost would rise. Therefore, the supply curve would shift to the left with the leftward shifting of the supply curve, the equilibrium price
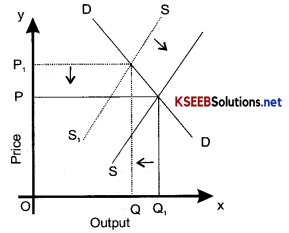
will rise and the quantity of the commodity willful as shown in the diagram.
Question 13.
If the price of a substitute(Y) of good X increases, what impact does it have on the equilibrium price and quantity of good X?
Answer:
If the price of the Y (substitute of good X) increses, its demand will fall and people will start consuming its substitute goods X. Thus the demand for X goods will increase. With the increase in demand for goods X, its demand curve will shift rightwards. With the rightward shifting of demand curve, both the equilibrium price and quantity will increases shown in the diagram.
![]()
Question 14.
Compare the effect of shift in demand curve on the equilibrium when the number of firms in the market is fixed with the situation when entry-exit is permitted.
Answer:
Comparision: When the demand curve shifts to right, there will be increase in the equilibrium price when the number of firms is fixed in the market as shown in the figure. On the other hand, if the demand curve shifts-to the left the price will fall as shown in the figure. There will be no increase or decrease in the supply as the number of firms are fixed and there is barrier on the entry and exit of firms.
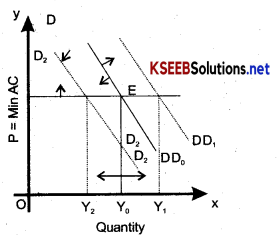
Now we take that market where entry and exit is permitted. We know that when we permit free entry and exit from the market, then the market at equilibrium always delivers output at minimum average cost of existing firm. Under this condition, even if the demand curve shifts in either direction, at equilibrium the market will supply the desired quantity at the same price in the diagram. In figure, DD0 is the market demand curve which tells us the quantity demanded by consumers at various prices and P0 denotes the price at which is equal to minimum average cost of the firms who are still is the market after entry-exit adjustment has been taken place. The initial equilibrium is at point E where the demand curve DD0 cuts the PQ = min AC line and the total quantity demanded and supplied is Y0.
Now suppose the demand curve shifts to the right. At price P0, there will be excess demand for the commodity which will push the price up. But the market will be in equilibrium only at PQ. So new firms must enter the market supply this additional demand P and pull the price back to PQ. In the diagram with the new demand curve DD, the equilibrium quantity is Y1 but the equilibrium price is still PQ. But since the equilibrium can be restored only at P0 Price, the supply must be eliminated through the exit of some existing firms which will push the price back to PQ. Therefore, at the new equilibrium quantity demanded and supplied will decrease Y2 whereas the price will remain unchanged at P0. Now fixed the number of firms will be less.
Conclusion:
In the end, we can say that with entry and exit, shift in demand has a larger effect on quantity than it does with the fixed number of firms. But unlike with a fixed number of firm; here we do not have any effect on equilibrium price.
Question 15.
Ejqdain through a diagram the effect of a rightward shift of both the demand and supply curves on equilibrium price and quantity.
Or
What happens to the equilibrium price and equilibrium quantity of a commodity sold in market when its supply increase (i.e. supply curve shifts downward) while the demand curve remains unchanged.
Answer:
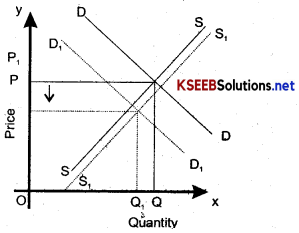
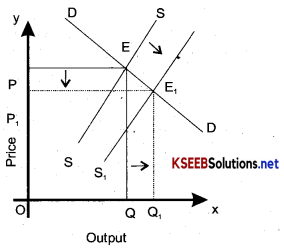
Here, we explain the impact of increase in supply on price and output of a commodity ^ when the demand for commodity remains the same. Suppose in the year there is good monsoon in India yielding bumper crop of wheat. This will increase the supply of wheat in the market causing a shift in its supply curve to the right. This impact of the increase in supply of wheat in the market causing a shift in its suply curve to the right. This impact of increase in supply of wheat on equilibrium price and quantity is graphically depicted in the figure.
Originally demand curve DD and supply curve SS of wheat intersect at point E and determines the equilibrium price of OP and equilibrium quantity OQ exchanged between sellers and buyers. Now due to good monsoon resulting in bumper crop of wheat and causing the supply curve of wheat to shift to the right from SS to the new poition S1S1 The new supply curve DD at point E1 at which the new lower equilibrium price OP and larger equihbrium quantity are determined. Thus, the increase in supply and consequently a rightward shift in the supply curve leads to fell inprice and an increase in equilibrium quantity.
Question 16.
How are the equilibrium price and quantity affected when,
(a) Do both demand and supply curves shift in the same direction?
Answer:
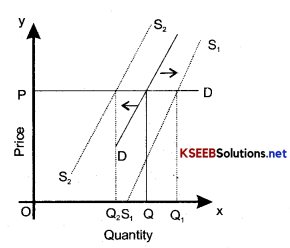
Effect of shifting demand and supply curves ¡n the same direction on the equilibrium price and quantity: Demand and supply curves may shift to rightwards or to leftwards. Suppose demand and supply curves both shift rightwards then the quantity will increase but the equilibrium price may increase, decrease or remain unchanged depending on the ratio between increase in demand and supply increases the same rate, then equilibrium price remains unchanged as shown in diagram.
(b) demand and supply curves shift in opposite directions?
Answer:
If the shift of the demand curve in leftward and that of supply curve in rightward, then the equilibrium price will decrease and the quantity may increase, decrease or remains unchanged as shown below in the diagram. On the other hand if the demand curve thifts rightward and the supply curve shifts leftward then equilibrium price increase, but the quantity may increase, decrease or remain unchanged as shown below in the diagram:
Question 17.
In what respect do the supply and demand curves in the labour market differ from those in the goods market?
Answer:
Difference between supply and demand curves in the labour market and supply and demand curves in goods market: The wages of labourers and prices of goods are determined following a similar mechanism under the forces of demand of supply the basic difference of labour market from the goods market is with respect to the sources of supply and demand. In the goods market, demand comes from household and the firms are suppliers. But in the labour market, households are the suppliers of labour and demand comes from firm. In goods market goods means quantity of goods whereas in labour market labour means the hours of work provided by the labourers and not the number of labourers.
![]()
Question 18.
How is the optimal amount of labour determined in a perfectly competitive market?
Answer:
Condition for optimal amount of labour determined in a perfectly compe
tive market : In the labour market, the demand for labour comes from firms. Hereby labour we mean the hours of work provided by the labourers and not the number of labourer. The main motive of each firm is to have the maximum profit. It can earn the maximum profit, if following condition is fulfilled.
W = MRPL
Where, MRPL = MR × MPL.
In perfectly competitive market marginal revenue is equal to price and price is equal to the value of marginal product (VMPL) hence, the condition for the optimal choice of labour is the equality between VMPL and the wage rate. As long as VMPL is greater than the wage rate, the firm will earn more profit by hiring more labour and the firm can increase its profit by reducing the labour employed at any level of labour employment. VMPL is less than the wage rate.
Question 19.
How is the wage rate determined in a perfectly competitive labour market?
Answer:
Determination of wage rate is perfectly labour market: In the labour market households are the suppliers of labour and the demand for labour comes from firms. By labour we mean the hours of work provided by the labourers and not the number of labourer. The wage is determined at the intersection of the demand and supply curve of labour where the demand for and supply of labour balanced.
Here we assume that labour is the only variable factor of production and the labour market is perfectly competitive i.e. each firm takes wages as given. Every firm’s goal is to get the maximum profit. We also assume that the technology of the firm is given and law of diminishing marginal products holds.
As the goal of each firm is given to have maximum profit, so it will always employ labour .upto the point. Where the extra cost incurs for the last labour is equal to the additional benefit it earns from employing the labour. The extra cost of hiring one more labour is the wage rate (W).
The extra output produced by one more labour is the wage rate (W). The extra output produced by one more labour is its marginal product (MPl) and by selling each extra unit of output, the addtional earning of the firm is the marginal revenue (MR) he gets from that unit. Therefore, for each extra unit of labour, it gets a benefit equal to the marginal revenue times marginal product which is called marginal revenue product of labour (MRPL).
Thus firm employes labour upto a point where
W = MRPL
Where, MRPL = MR × MPL
Question 20.
Can you think of any commodity on which price ceiling is imposed in India?
What may be the consequence of price-ceiling?
Answer:
Yes, there is price ceiling on wheat, rice, sugar, kerosene etc.
The government fixes the price lower than the equilibrium price. It will lead to exess demand. It means there is shortage of supply at the control price. There will be some buyers who are willing to pay a higher price than the control price. It will lead to black marketing.
Question 21.
A shift in demand curve has a larger effect on price and smaller effect on quantity when the number of firms is fixed compared to the situation when free entry and exit is permitted. Explain.
Answer:
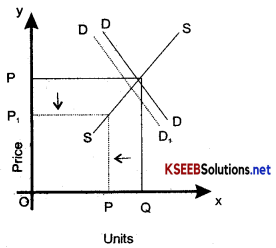
With the shift in demand curve there is a great change in the price of the goods, but less effect on the quantity. Suppose the demand curve shift rightwards. In this case, there will be great increase in the price, but quantity will be affected as shown in the diagram.
The reason is that the number of firms are fixed. The fixed number of firms can increase production a little. Due to increase in demand the price will rise high as compared to rise in the quantity. But with the rise in price (rise in profit), more firms will enter the industry-leading to increse in the quantity supplied. The entry ofnew firms into the industry will continue till the current price lowers to the equilibrium price. Hence in the market with free entry and exist, the rightward shift of the demand curve, the price will be less affected and quantity will be much affected.
![]()
Question 22.
Suppose the demand and supply curve of commodity X in a perfectly competitive market are given by:
qd = 700 – p
qs = 500 + 3p for p ≥ 15
= 0 for 0 ≤ p < 15
Assume that the market consists of identical firms. Identify the reason behind the market supply of commodity X being zero at any price less than Rs 15.
What will be the equilibrium price for this commodity? At equilibrium, what quantity of X will be produced?
Answer:
In the question qd and qs denote the demand and supply respectively and P denotes the price of commodity X, when its price is below Rs. 15. We know that the firms produce a positive quantity of output only when the price is below minium AVC, they produce nothing. Therefore, the minimum average cost of producing commodity X is Rs. 15. Here the price is Rs. 15. At equilibrium from the supply curve we get the quantity of supply. At equilibrium price
qd = qs
700 – P = 500 + 3P
Or
– 4P = -200
P = 50
Hence equilibrium price = Rs. 50
Equilibrium price = Rs, 50
Equilibrium quantity=700 – P
= 700 – 50 = 650
Question 23.
Considering the same demand curve as in exercise 22, now let us allow for free entry and exit of the firms producing commodity X- Also assume the market consists of identical firms producing commodity X. Let the supply curve of a single, firm be explained as
qs = 8 + 3p for p ≤ 20
= 0 for 0 ≤ p < 20
(a) What is the significance of p = 20?
(b) At what price will the market for X be in equilibrium? State the reason for your answer.
(c) Calculate the equilibrium quantity and number of firms.
Answer:
Significance of P = 20 is that the equilibrium price determined by market demand and market supply forces.
At the price of Rs. 20, the market for X will be in equilibrium.
Equilibrium quantity = 700 – P
= 700 – 20 = 680
Quantity produced by a firms = 8 + (3 × 20) = 68
No. of firms = \(\frac{680}{68}\) = 10
Question 24.
Suppose the demand and supply curves of salt are given by:
qd = 1,000 – p
qs = 700 + 2p
(a) Find the equilibrium price and quantity.
(b) Now suppose that the price of an input used to produce salt has increased so that the new supply curve is
How do the equilibrium price and quantity change? Does the change confirm your expectation?
(c) Suppose the government has imposed a tax of Rs. 3 per unit of sale of salt. How does it affect the equilibrium price and quantity?
Answer:
(a) At the equilibrium price, the demand is equal to supply. Hence qd = qs.
Or
1000 – P = 700 + 2P
Or
-P – 2P = 700 – 1000
Or
-3P = -300
P = 100
Hence equilibrium price = Rs. 100
Equilibrium quantity = 1000 – P = 1000 100 = 900
Equilibrium quantity = 700 + 2p = 700 + 200 = 900
(b) Now 1000 – p(qd) = 400 + 2p(qs)
Or
-p – 2p = 400 – 1000
Or
-3p = -600
Or
P = \(\frac{600}{3}\) = 200
Hence, equilibrium price = Rs. 200
Equilibrium quantity=400 + 2p = 400 + 400 = 800 Units.
Increase in price = 200 – 100 = Rs. 100
Decrease in quantity=900 – 800-100
(c) The supply curve will shift to its leftwards.
Question 25.
Suppose the market-determined rent for apartments is too high for common people to afford. If the government comes forward to help those seeking apartments on rent by imposing control on rent, what impact will it have on the market for apartments? Impact on the market for apartments:
Answer:
- The consumers will get inferior quality houses. This is because the builders getting lower price will in turn produce low quantity goods in order to reduce their cost of production.
- Due to rent control, there will be excess demand for apartments. Every person desiring of having apartments will not be able to get the apartment on rent. There will be a long waiting list.
- Since all the persons seeking apartments on rent control will not get the apartments, some of them will be willing to pay higher rent for the apartments. As a result there will be black marketing for apartments on rent.