Karnataka 2nd PUC Statistics Notes Chapter 1 Vital Statistics
High Lights of the Topic:
→ Statistical study of human population is called Demography. The Vital statistics is the branch of statistics which deals with human population.
→ “Vital statistics is the science which deals with analysis and interpretation of numerical facts regarding vital events occurring in a human population.”
→ A vital event means events of human life such as births, deaths, marriage, divorce, sickness, migration etc.
![]()
Uses of vital statistics:
Vital statistics are useful in the following purposes:
→ To study the demographic structure and trend in the population.
→ In public administration such as in planning, evaluation of economic and social development, to assess the impact of family welfare programmes of the country.
→ To operating agencies such as governments for administrative purposes, Insurance agencies where actuarial are calculated for the life insurance policies.
→ To researchers in fields of demography, pharmaceutical, sociological and Medical
→ They are highly useful to an individual by the way of recording birth, death, marriage, and divorce during his or her life time.
→ They are also of great use in international point of view.
Sources of vital statistics:
→ Vital statistics can be obtained by the following methods:
- Registration method
- Census method
1. Registration method:
This is the method of obtaining continues permanent compulsory recording of vital event as and they happen, due to the legal importance’. Here vital statistics are obtained from the registers/records of Municipal offices, gram panchayath offices, Hospitals etc. When births are registered, information of age of mother, sex of the child, caste, religion etc, are recorded. When deaths are registered, information of sex, religion, marital status, age at death, cause of death etc, is recorded. Similarly marriages are registered, information regarding age, caste, etc, is recorded. Since registration of vital events is compulsory in India, this method is considered as reliable.
2. Census method:-
→ ‘This is the method of complete enumeration of each and every vital events of the population at equal intervals’. In India once in every 10 years (Decennial) population census is conducted. In these censuses, information regarding birth, death, gender, marriage, literacy, occupation/ employment, economic status etc, are collected.
→ This method is accurate and more exhaustive than vital statistics obtained by registration method. But for the years other than census year they are out dated, so the information is available for the census year only. Census data fail to provide vital statistics for intercensal years.
![]()
I. Measurement of population:
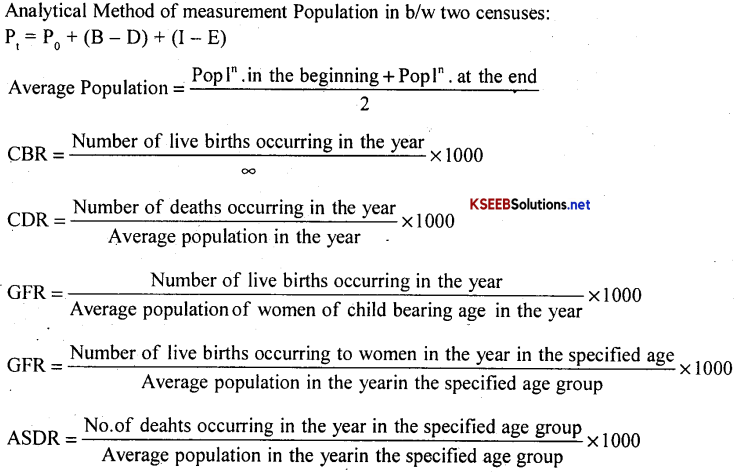
Analytical method: To estimate population in between the two censuses, we use the following formula to estimate the population at time ‘t’ (year).
ie. Pt = Po + (B – D) + (I – E).
Where Pt = population at time t; Pt = population in the census year.
B, D, I and E are the total number of Births, Deaths, Immigrants and Emigrants between the census year and time ‘t’ {i.e. the time of measurement}
II. Measurement of Fertility (Births):
→ The increase of population due to births is measured by Birth Rate or Fertility rate.
→ Fertility refers to the births occurring to women of child bearing age. ‘Fertility rate refers to the number of live births occurring to women of childbearing age’. Women’s age between (15-49) years will be considered as ‘child bearing age’ ,also called as germination period.
→ Fecundity refers to a ‘the capacity of a woman to bear children’.
The different measures of fertility are:
- Crude Birth Rate (CBR)
- General Fertility Rate (GFR)
- Age-Specific Fertility Rate (ASFR)
- Total Fertility-’ Rate (TFR)
1. Crude Birth Rate:
‘It is the average number of live births occurring in a year to 1000 population’.
CBR = \(\frac{\text { Number of live births occurring in the year }}{\text { Average population in the year }} \times 1000\)
Flere ‘Average population’ means average of the population in the beginning of the year and the population at the end of the year.
Merits:
- It is simple to understand and easy to calculate.
- It indicates the rate of growth of population due to births.
- It does not require sex and age composition of the population.
- It cannot be used to compare birth rates of two or more populations.
Demerits:
- It ignores the age and sex composition of the population.
- It includes both men and women populations, but birth rate is more meaningful Women of child bearing age alone are considered.
2. General Fertility Rate [GFR]:
This is the fertility rate which is calculated for women of child bearing age.
‘GFR is defined as the average number of live births occurring in a year to 1000 women of child bearing age’. A woman aged [15-49] years is considered as ‘child bearing age’.
GFR = \(\frac{\text { Number of live births occurring in the year }}{\text { Total number of women population of child bearing age in the year }} \times 1000\)
Merits:
- It is simple to understand and easy to calculate.
- It is based on women population of child bearing age; it is good measure than C.B.R
- It can be used for comparison of fertility of different populations.
Demerits:
- It does not take into consideration of the age composition of the women population
- It does not indicate rate of growth of the population due to births, because it is based on only a part of the population.
- It cannot be used to compare fertility rates of two or more populations
![]()
3. Age-Specific Fertility Rate [ASFR]:
ASFR is ‘the average number of live births occurring to one thousand women population of a specific age group in a year’.
ASFR = \(\frac{\text { No.of live birts occurring to women in the specified age group in the year }}{\text { Total population of women in the specified age group in the year }} \times 1000\)
For example ASFR for the specific age group (20-24) years.
ASFR(20 – 24) = \(\frac{\text { No.of live births occurring to women aged }(20-24) \text { years in the year }}{\text { Total population of women aged }(20-24) \text { year in the year }} \times 1000\)
ASFRs which are computed for the age groups of width 5 years each are called Quinquennial Age Specific Fertility Rate.
Ex: ASFRs for the age groups (15 – 19), (20 – 24) ……………. (40 – 49) years Or (15 – 20), (20 – 25) …… (40 – 50) Years.
ASFRs computed for every completed year of age are called Annual ASFRs.
Ex:- ASFR for the ages 15, 16, 17 …………. 49 years.
Merits:
- It considers both age and sex composition of the population.
- It is used in the computation of total fertility rate.
- It can be used for comparison of fertility among the age groups in the same population.
Demerits:
- It cannot be used for comparison of fertility of different populations.
- It does not indicate the growth of population due to births.
4. Total fertility Rate:
When fertility of different populations is needed to compare total fertility is used. It is the average number of children that would be born to a woman over her lifetime if she were to survive through the end of her reproductive life.
‘It is sum of ASFRs calculated at 5 years age interval ie Quinquennial A.S.F.R’s OR It is the sum of annual ASFRs for all the ages’.
i.e. TFR = 5 Σ Quinquennial ASFR OR
TFR = Σ Annual ASFR
TFR divided by 1000 gives average number of children born in life time to one woman.
ie. Average number of children born per women = \(\frac{\mathrm{TFR}}{1000}\)
Merits:
- It is used for comparing the fertility rates of different populations.
- It gives due weightage to age composition.
- It considers only female population of child bearing age.
Demerits:
- It is difficult to calculate and requires calculating all ASFRs
- It does not indicate rate of growth of population due to births
- It is assumed that women will survive for (15-49) years.
![]()
III. Reproduction Rates:
For measuring the rate of growth of population we calculate the reproduction rates. Reproduction rates are of two types.
- Gross Reproduction Rate
- Net Reproduction Rate
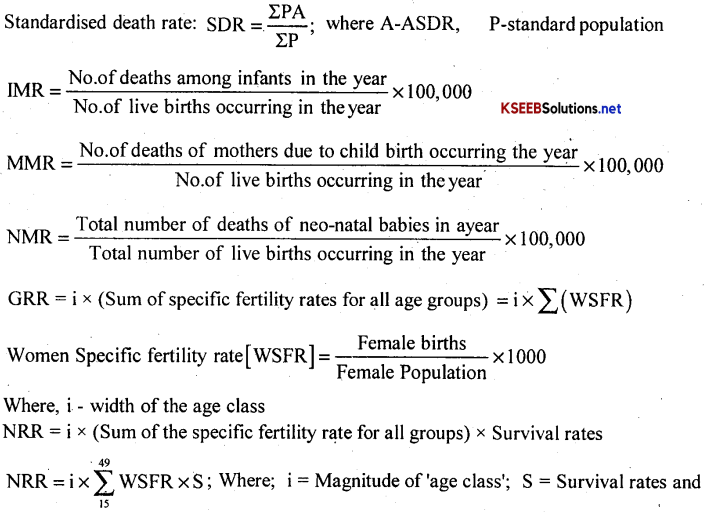
1. Gross Reproduction Rate [GRR]: The gross reproduction rate (GRR) is “the average number of female children expected to give birth during her entire reproduction span conforming to age specific fertility rates for a given year, if there are no mortality.”
GRS = i × (Sum of specific fertility rates for all age groups)
= i × Σ(WSFR); Where, i – width of the age class
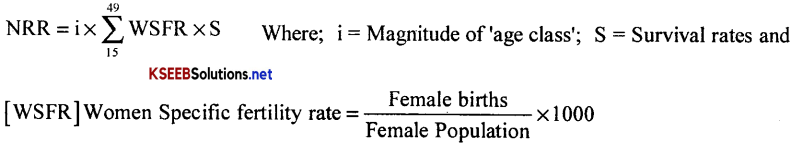
Women Specific fertility rate[WSFR] = \(\frac{\text { Female births }}{\text { Female Population }} \times 1000\)
Merits:
- It is useful for comparing fertility in different areas or in the same area at different time periods.
- It has an advantage over the total fertility rate because in its computation we take into account only the female babies, who are the future mothers.
Demerits:
- It ignores the current mortality. All the girls born do not survive till they reach the child bearing age.
2. Net Reproduction Rate [NRR]:
It is defined as the average number of daughters that would be born to a female, if she passed through her life time conforming to the ASFR and Mortality rates of a given year.
NRR = i × (Sum of the specific fertility rate for all groups) × Survival rates
Merits:
- It takes into account current fertility and current mortality.
- It will show a tendency of increase or decrease in population.
Demerits:
- It assumes constant rates of fertility and mortality over a generation. In actual life, both these rates go on changing.
- The population of a country may become depleted more by migration than by declining birth rate.
- It cannot be used for forecasting future population changes.
![]()
IV. Measurement of Mortality:
→ The decrease of population due to deaths is measured by a Death Rate or mortality rate. Here ‘morality refers to deaths occurring in the population’.
→ Deaths may occur to persons of different ages and due to different causes.
The following are the important measures of mortality
- Crude Death Rate
- Age Specific Death Rate
- Standardized Death Rate
- Infant Mortality Rate
- Neo-natal Mortality Rate
- Maternal Mortality Rate
1. Crude Death Rate[CDR]:
It is general measure of mortality for the population as a whole. It is defined as ‘the average number of deaths occurring in the year per 1000 population’.
CDR = \(\frac{\text { No. of deaths occurring in the year }}{\text { Average population in the year }} \times 1000\) × 1000
Merits:
- It is simple to understand and easy to calculate.
- It indicates the rate of decrease of population due to deaths.
- It does not require age and sex composition of the population
Demerits:
- It does not give importance to age and sex composition of the population.
- Hence it cannot be effectively used for comparison of mortality of different populations.
2. Age Specific Death Rate (ASDR):
The crude death rate ignores the age composition. Specifically in the group (0-5) and (Above 60) the death rate is more and it is less in the age group of (25-40). Thus, we define age- specific death rates.
It is defined as’ the average number of deaths occurring in the specified age group in the year per 1000 population’.
ASDR = \(\frac{\text { No.of deaths occurring in the year in the specified age group }}{\text { Total population in the year in the specified age group }} \times 1000\)
For example ASDR for the age group (0-9) years is:-
ASDR = \(=\frac{\text { No. of deaths occurring in the year in the age group }(0-9) \text { years }}{\text { Total population in the year in the age group }(0-9) \text { years }} \times 1000\)
Merits:
- It includes age composition of the population.
- It is used in the computation of standardized death rates.
Demerits:
- It cannot be used for overall comparison of mortality conditions in two different regions.
- It ignores social and occupational factors.
Note: One may also calculate cause-specific-death-rates due to Road accidents, Heart attacks, Cancer or AIDS etc.
![]()
3. Standardized Death Rates (STDR):
For comparing death rates of different populations Standardized Death Rates are used. “SDR is defined as the weighted average of the ASDR’s with respect to Standard population”
SDR = \(\frac{\sum \mathrm{PA}}{\sum \mathrm{P}}\) Where P – Standard population and A – ASDRs
Here one particular population is taken as standard and then, based on the age structure of this population, death rates for the given populations are computed. It is assumed that the given population has common age structures as that of standard population. This is done by finding a weighted average and the ASDR’s for the respective populations. Suppose there are two towns A and B. The computation of SDRs is:
SDR (A) = \(\frac{\sum \mathrm{PA}}{\sum \mathrm{P}}\); SDR(B) = \(\frac{\sum \mathrm{PB}}{\sum \mathrm{P}}\);
Where P – Standard population common for both
A – ASDRs of population A and B
Merits:
- It includes age compositions of the population; it is a good measure of mortality as Compared to CDR and ASDR.
- It can be used for comparison of mortality of different populations.
Demerits:
- It is tedious to compute.
- It requires a standard population and is very difficult to select the Standard Population among the given populations.
4. Infant mortality Rate (I.M.R):
‘I.M.R is the average number of deaths occurring among Infants per 1000 infants population in the year’ (children in the age group (0-1) years called Infants)
IMR = \(=\frac{\text { No.of deaths among infants in the year }}{\text { No. of live births occuring in the year }} \times 1000\)
5. Neo-Natal Mortality Rate [NMR]:
Neo-natal mortality rate is defined as ‘the average number of neo-natal deaths per 1000 live births in a year’.
NMR = \(=\frac{\text { Total number of deaths of neo }-\text { natal babies in a year }}{\text { Tota I number of live births occuring in the year }} \times 1000\)
Here, neo-natal babies’ means new born babies aged less than 28 days/one month.
6. Maternal mortality rate (M.M.R):
‘Maternal Mortality Rate refers to the number of deaths occurring among women at the time of child birth in the year’. Since this number is very small, M.M.R is measured per 100,000 live births.
MMR = \(=\frac{\text { No.of deaths of mothers due to child birth occurring the year }}{\text { No.of live births occurring in the year }} \times 1000\)
No.of live births occurring in the year
![]()
Life Table:
→ ‘Life Table is a tabular presentation of numerical data describing the mortality experience of a cohort’.
→ Here Cohort is a group of individuals who are assumed to born at the same time and experience the same mortality conditions. The size of the cohort is called Radix.
→ Here Radix = 1 Lakh individuals.
The following are the components of a Life Table:
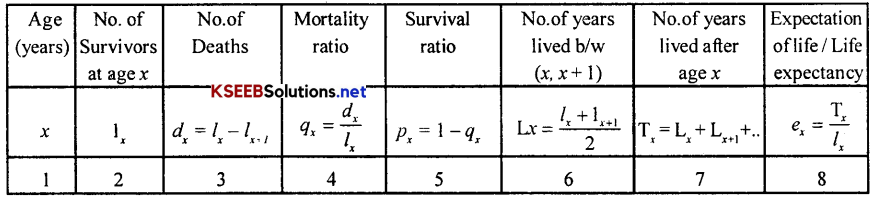
Components of Life table can also be explicitly written as below:-
Columns:
→ x: be the age of a person .
→ lx: be the no. of persons living at age x
→ dx: be the no. of persons die between age x and x + 1. i.e. dx = (lx – lx + 1)
→ qx: Mortality rate/Ratio. It is the Probability that a person of aged x dies between age (x, x + 1) ie. qx = \(\left(d_{x} / 1_{x}\right)\)
→ Px: Survival rate / Ratio ie. It is the Probability that a person age x survives up to age (x + 1) ie. Px = 1 – qx
→ Lx: Total no. of years lived in the aggregate b/w age x and x + 1, i.e., Lx = \(\left(\frac{l_{x}+l_{x+1}}{2}\right)\)
→ Tx: Total no. of years lived by the cohort after attaining age x, i.e. Tx = Lx + Lx + 1 + ……..
→ ex: is the Expectation of life (life expectancy) at age x, i.e., ex = \(\left(\mathrm{T}_{x} / l_{x}\right)\) It is the average number years that a person of a given age x can expected to live.
![]()
Uses:
Life tables uses are:
- They are used in computation of actuarial of premium, bonus etc, of policies by Insurance Agencies.
- Life Tables are used in research activities in Biology, Medicine, Pharmacology, Demography, Psychology, Sociology etc.
- They are used to study population growth and forecast the size and sex distribution of the Population.
- Life Tables give Mortality and Survival rates/ratios at different ages.
- Life tables give the life expectancy at different age. Here “Life expectancy, of a New born baby is called Longevity”
- These are useful in public administration, heath care, planning and population control etc. Life Table is also called as the Biometer of the population.
Formulae: