Karnataka 2nd PUC Statistics Notes Chapter 7 Statistical Quality Control
High Lights of the Topic :
The Quality control and Statistical quality control (SQC):
→ “statistical quality control is the method of controlling the quality of the products using statistical techniques”.
→ Here the term ‘quality’ refers to a characteristic of a product which satisfies the standards specified for measurement.
![]()
Sources of Variation:
The variation in quality of goods may be due to
- Chance causes and
- Assignable causes.
1. Variation due to chance causes:
→ These are called common or random causes of variation. These types of variation are unavoidable and are due to slight differences in processing.
→ ‘A small amount of variation for which no specific cause can be attributed (recognized) is termed as chance causes of variation’.
→ Chance variation causes cannot be reduced or eliminated by any statistical means. Hence one has to tolerate such variations and this variation is called natural tolerance.
2. Variation due to assignable causes:
→ The second type of ‘variation that can be observed in the quality of the product and the causes can be identified and eliminated. These are called assignable causes of variation’.
→ Causes of these type of variation may be due to-use of substandard quality of raw material, un even supply of electrical voltage, untrained men handling the machine, improper functioning of machine etc., These causes of variation can be identified and eliminated.
→ The manufacturing process has following stages. They are
- Specification/product specification
- Production
- Inspection
1. Specification/product specification: Specification is the quality standards of measurements fixed for an item to be produced. An item produced from the production process according specifications, is called production. Verification of the quality standards of the manufactured item is inspection.
![]()
Uses / Need / Advantages of SQC:
SQC is very essential because
- To improve the quality of items and to decrease the proportion of defectives.
- To eliminates faults and prevents the loss due to spoilage and rework by timely identification of assignable causes.
- To prevent the financial loss- by changing the production method if the production process goes out of control.
- Manufacturer can guarantee or warranty his product with confidence.
- It provides greater quality assurance at lower inspection cost. ,
- The very presence of SQC department, alerts the workers in the production plant.
- The quality control technique has two different stages in production process:
(i) Process control:
‘Controlling the quality of the goods, during the manufacturing process itself is called process control’. That is, a production process is said to be in statistical control if the products are free of variations due to assignable causes.
(ii) Product control:
‘The process of inspection of manufactured lot for acceptability is called product control or acceptance sampling’.
Variables and Attributes:-
→ If the record of the actual measurements of quality characteristics for an individual item are specified, we use averages and standard deviations.
→ ‘A measurable quality characteristic which varies from unit to unit is Variable’.
ie., generally expressed with statistical measures such as averages and standard deviations (range). Where sophisticated instruments (caliper) used to measure.
Example 1:
→ Length, Breadth, Ht, Wt, Resistance, thickness, tensile strength of articles, volume, of the manufactured articles, Other examples are the weight of a bag of sugar, the temperature of a micro oven, or the diameter of plastic pipes, etc.,
→ X̄ and R charts are used for the control of variables.
→ ‘A qualitative characteristic which cannot be measured and can only be identified by its presence or absence is an Attribute’.
ie., a performance characteristic that is either present or absent in the product or service under consideration. Most quality characteristics in service industry are attributes
Example 2:
→ Broken, cracks, scratches, bubble, improper less/more colour painting/tint of articles/glass dome number of broken Potato chips, infested apples, improper reflection of mirror, spots of uneven thickness or folds in paper, knitting defects on a cloth etc.,
→ np-charts and c-charts are used for control of attributes.
![]()
Defects and Defectives:
→ ‘A defect is a quality characteristic which does not conform to specifications.’
→ Misprints, damages in weaving of a cloth, a bubble in the glass bottle, excessive thickness of a glass pane, an infest in apple, a fold or scratches in paper and example 2 are all defects.
→ ‘An item having one or more defects is a defective item’.
→ The cloth with misprints, glass bottle having air bubbles, excessive thickness of a glass pane are all defectives.
3σ – limits:
→ We know that mean-X̄ and S.D-σ follows a normal variate and so, assuming that the production process follows a normal distribution/curved then, from the area property of Normal distribution: P(µ – 3σ < X < µ + 3σ) = 0.9974.
→ “In the constructing control charts, control limits are nothing but 3 o-limits. If the manufacturing process is said to be in control, then 99.73% of observations lies within 3 o-limits”. Here almost all chance causes are within control limits, if not, is an indicator of presence of Assignable causes.
Developing Control Charts:
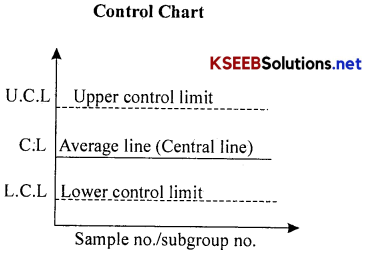
→ A control chart is a graph that shows whether a sample of data falls within the common or normal range of variation.
→ “Control chart is a graphical device which is used to verify whether the production process is under statistical control or not”.
→ A control chart has upper and lower control limits that separate common from assignable causes of variation. A control chart consists f three horizontal lines.
![]()
Quality Standards for control limits:
→ For drawing the control charts we need parameters (standards). If the parameters are available from past production process/ experience/expected and if they are well accepted we say that they are known standards.
→ If the standards known are denoted by X̄’ – mean, S.D – σ (for X̄, R-charts), P1 – fraction/ proportion of defectives (for np-chart) and λ’ – average defects (for c-charts).
→ If a control chart is being constructed for a new process, the mean (µ) and σ (the population parameters) will not be known and hence must be estimated from the sample data, then we say that standards are not known.
→ If the standards not known are denoted by X̄, R̄ (for X̄ > R-charts), p̄ (for np-chart) and c̄ (for c-charts).
Control Charts for Variables:
For mean/averages and s.d/ranges-
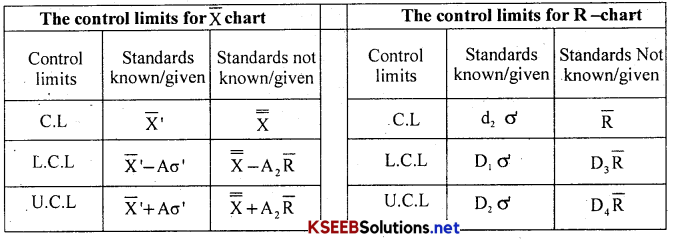
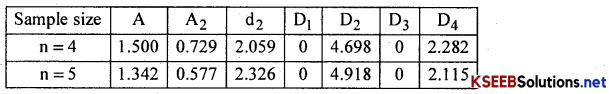
Where X̄’, σ’ are given standards, and if not given, X̄ = \(\frac{\sum \mathrm{x}}{\mathrm{n}}\) and X̿ = \(\frac{\sum \mathrm{x}}{\mathrm{k}}\) also R̄ = \(\frac{\sum \mathrm{R}}{\mathrm{k}}\) where K is the number of samples/sample no./subgroup no. The constants A, A2, d2, D1, D2, D3 and D4 are referred from the tables for for samples n = 4/5. {only for X̄ and R-charts}
Control Charts for Attributes:
Suppose samples of size ‘n’ are drawn at regular intervals and ‘d’ is the no. of defectives in each of these samples. Then ‘d’ is a Binomial variable with mean ‘np’ and standard deviation √nPQ, where P is the probability that an article is defective.
The control limits for the np/d-(defectives) chart:
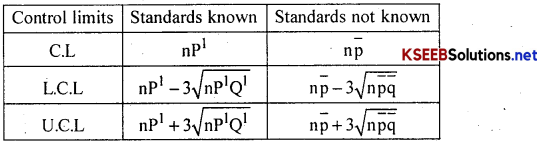
→ Where P’ is the proportion of defective the given standard and Q’ = 1 – P’, if not given: p̄ = \(\frac{\Sigma \mathrm{d}}{\mathrm{nk}}\);
→ where n-sample size and p̄ = \(\frac{\text { Total number of defective items }}{\text { Total number of observations in k samples }}\)
![]()
C – Chart for number of defects: Suppose ‘c’ denotes the number of defects per unit. Then ‘c’ is a Poisson variable with mean λ and standard deviation √λ, where λ is the average number of defects per unit in the population. The control limits for c – charts are as follows:-
The control limits for c – charts:
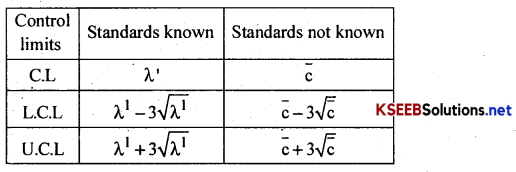
Where c̅ = \(\frac{\Sigma \mathrm{c}}{\mathrm{K}}\) is average number of defects.
Interpretation of control charts (Detection of Lack of control):
We say that a process is out of control when a plot of data reveals that one or more samples fall outside the control limits.
- One or more points lie outside the control limits.
- A run of seven or more subsequent points lie to one side of the central line.
- Upward or downward trend in the points.
- Presence of cyclical variation in the points.
Acceptance sampling plan:
→ “The process of inspection manufactured lot for acceptability is called acceptance sampling plan”.
Manufactured lot can be verified either by
- 100% inspection ie. by verification of each and every item of the manufactured lot or
- Sampling techniques: A sampling plan is a plan for acceptance sampling that precisely specifies the parameters of the sampling process and the acceptance/rejection criteria.
→ In acceptance sampling there are two methods(sampling plans). They are
- Single sampling plan and
- Double sampling plan.
![]()
Merits:
- It helps to decide whether or not desirable quality has been achieved for a batch of products.
- It is used when the items are of destructive in nature.
- It is less expensive.
Demerits:
- There is a risk of accepting a bad lot and rejecting a good lot.
- Costly and time consuming.
1. Single sampling plan (SSP):
→ In SSP where a random sample of items are drawn from every lot. Each item in the sample is examined and is labeled as either good or bad, depending on the number of defects or bad items found, the entire lot is either accepted or rejected.
→ “In a single sampling plan, the decision about accepting or rejecting a lot is based on one sample only.”
→ In this method, in a lot of size N, the sample size ‘n’ is drawn from the lot and’d’ be the number defectives in the sample and ‘c’ be the maximum number of defects at which a lot is . accepted. These parameters define the acceptance sampling plan.
Then SSP is :
- If d ≤ c, accept the lot and replace ‘d’ defectives by good ones.
- If d > c, the entire lot is inspected and all defectives are replaced.
2. Double sampling plan(DSP):
→ This provides an opportunity to sample a lot a second time if the results of the first sample are inconclusive.
→ “In a double sampling plan, the decision is based on two samples drawn from a lot.”
→ Let N be the lot size, let n, and n2 be sample sizes of first and second samples. Let c1 and c2 be two acceptance numbers (here c1 < c2).
Then DSP is:-
- If d1 ≤ c1 accept the lot, where d1 – no of defectives in the n1 samples
- If d1 > c2, reject the lot. Inspect the entire lot and replace the didefectives by good ones.
- If c1 < d1 ≤ c2, another sample n2 is drawn from the lot.
- If (d1 + d2) ≤ c2 accept the lot. Where d2 – no. of defectives from second sample, However (d1 + d2) defectives are replaced by good one.
- If d1 + d2 > c2 Reject the lot, inspect the entire lot and replace all defectives by good ones.
![]()
Merits and Demerits:
→ S.S.P is easier and simpler than the D.S.P.
→ Manufacturer feel more assured psychologically (regarding the defectives) in D.S.P than S.S.P.
→ In D.S.P in case the lot is accepted at the first stage itself, there would be reduction in the number of items inspected. And so, on an average the inspection cost would be less in D.S.P. than SSP.