Karnataka 2nd PUC Statistics Notes Chapter 8 Operation Research
High Lights of the Topic:
→ Strategic problems relating to military forces, a group of scientists and experts, suggested appropriate allocations of available resources, and they helped in elficient handling the complex military operations, such as detection of enemy submarines, anti aircrafts, fire control etc, and they called the concept as Operations Research (OR).
→ However afterwards the science becomes popular, the applications (uses) of OR was applied to general problems such as, problems concerning Industry, Marketing, Personnel management, Inventory control, etc.
→ Therefore OR can be defined as “It is the method of application of scientific methods, techniques and tools to problems involving the operations of a system, so as to provide those in control of the system with optimum solutions to the problem.”
![]()
Scope:
Some of the problems in real life situations (problems) discussed in Operations Research (OR), are-
(i) Linear programming problems(LPP) are used in Industries for effective use of men, machine, money and material.
(ii) Transportation problem (TP) helps in shipment of quantities from various sources to different destinations at a minimum cost.
(iii) Game theory is applied in conflicting situations, to suggest the best strategy.
(iv) Replacement problems helps in suggesting the best time period to replace a specific part in manufacturing process, and
(v) Inventory problems help in organizing stocks and maintaining costs, and so on.
(i) Linear Programming Problem (LPP):
→ In many Economic activities, i.e. of Business and Industrial field, we often face the problems of decision making or optimization (may be Maximization/Minimization) of profit, sales, cost, labour etc, is very important. On the basis of available resources(called constraints), such as Demand for commodities, availability of raw materials, storage space, variation in costs, etc, In such situations where conditional optimization is required we may adopt ‘Linear programming’ model.
→ It was in 1947 that George Dantzig and his associates introduced the Linear programming technique and simplex method of solving problems concerning military activities.
→ Here “Linear programming is a mathematical technique which deals with the optimization (Maximization or Minimization) of activities subject to the available resources.”
For example:
1. A biscuit manufacturing factory may be interested in taking decisions regarding the type of biscuits to be manufactured and the quantity produced so as to earn maximum profit.
2. A factory having some machines to manufacture cars would like to know the best way to utilize the machines so that maximum production is made possible in minimum time available,
3. A dietician may want to suggest food with a certain basic vitamins and proteins. She may like to know the best way to prescribe food with optimum requirement of vitamins and proteins at the minimum cost.
![]()
Formulation of LPP:
- Identify the unknown variables- known as Decision variables and denote them in terms of algebraic symbols (as x,y).
- Identify the Objective of the problem and represent it as Z.
- Identify the restrictions called constraints in the problem and represent them as equations or inequalities in terms of symbols (as ≤ = ≥).
LPP Model :-
(Matrix Notation) Optimize Z = CX
Subject to the constraints- AX(≤ = ≥)b
and the non-negativity restriction X ≥ 0 ; is an LPP
Example:
A manufacturer produces two models of products Model A and Model B
(i) Model A fetches a profit of Rs.200/- per set. Whereas Model B fetches Rs.500/- per set.
(ii) Model A requires 6 units of raw material and Model B requires 3 units of raw material. Every week there is a supply of 180 units of raw materials.
(iii) Model A requires 4 hours and Model B requires 8 hours labour. The total labour available is 160 hours per week.
→ With the above facts, the manufacturer is to decide the number of Model A Products and number of Model B should he manufacture. In taking decision he should maximize his profit, on the basis of availability of Raw materials and the labour available.
→ The manufacturer’s problem can be mathematically written down (formulated) as follows:-
→ Let Y denote the number of units of Model A products to be manufactured. Let ‘y’ denote the number of Model B products to be manufactured. (x,y-decision variables)
→ Then, the manufacture’s profit is- (objective function)
Max. Z = 200x + 500y
(Restrictions are-) Subject to constraints; 6x + 3y ≤ 180
Since the weekly supply raw materials are 180 units, at the most 180 units can be utilized.
4x + 8y ≤ 160
![]()
→ Since total labour available is 160 hours.
Also the number of products cannot be negative, and so, X ≥ 0, Y ≥ 0
Thus, the formulated form of the the manufacturer problem (LPP) is;
Maximize = 200x + 500y
Subject to constraints, 6x + 3y ≤ 180.
4x + 8y ≤ 160
And non-negative restrictions: x,y ≥ 0 is an LPP
→ Definition: Linear programming deals with the optimization of a linear function of variables known as ‘objective function’ subject to a set of linear equalities / inequalities known as constraints.
→ Objective function: The function Z = CX which is to be optimized (Maximised/Minimised) is called Objective function. {E.g. Maximize = 200x + 500y}
→ Decision variable: A variables be ‘x1, x2, x3 ………… xn‘ whose values are to be determined are called decision variables.
{E.g: x, y variables}
→ Solution: A set of real values X = (x1, x2, x3 ………… xn) which satisfies the constraints AX(≤ = ≥)b is called a solution.
→ Feasible solution: A set of real values X = (x1, x2, x3 ………… xn) which satisfies the constraints AX(≤ = ≥)b and also satisfies the non-negativity restrictions x ≥ 0 is called feasible solution.
→ Optimal solutions:
A set of real values X = (x1, x2, x3, ………. xn) which
- Satisfies the constraints AX(≤ = ≥)b.
- Satisfies the non-negativity restriction x ≥ 0 and
- Optimizes the objective function Z = CX is called optimal solution
Note:
- If an LPP has one optimal solution, it is called to have unique optimal solution
- If an LPP has many optimal solutions, it is said to have multiple/Multiple Optimal solutions.
- For some LPP may not have optimal solution or the optimal value of Z may be infinity, in this case the LPP is said to be unbounded solution.
- In an LPP if all constraints cannot be satisfied simultaneously then there exists no solution to the given LPP.
![]()
Finding the solution to a LPP by graphical method:
- Consider the constraints as equality
- Find the co-ordinates for each constraint
- Draw the graph and represent by straight line
- Identify the feasible region-which satisfies the non-negativity restriction and constraints simultaneously
- Locate the corner points of the feasible region
- Find the value of the objective function at the corner points
- Get the optimum value and suggest the solution to the LPP
Note: Feasible can lie/exists only in First quadrant’: because for the given LPP, the solution . can exists only on xy-plane, because of the non-negativity restrictions, x and y both are positive on xy-plane.
(ii) Transportation Problem (T.P)
→ T.P was introduced by F.L.Hitchcock (in 1941) and T.C.Koopman (in 1947).
→ “The transportation problem (T.P) is a problem concerning transportation of goods from different origins (factories, warehouses/godowns) to various destinations (dealers, customers)”.
→ Here each origin has a certain stock of goods and each destination has a certain requirement of goods and there is a certain cost associated with transportation of goods from the various origins to the different destinations.
![]()
→ Following terminology are used of transportation problem:
- Let ‘m’ be the number of sources or origins.
- ‘n’ be the number of destinations.
- ‘ai’ be the quantity of goods available at ith source
- ‘bj’ be the quantity of goods required at jth destination.
- ‘Cij’ be the cost of transportation of unit of goods from ith source to jth destinations.
- And ‘xij’ be the number of units to be transported from ith source to jth destination.
→ Formulation of T.P:
Consider a T.P with ‘m’ origins O1, 02 . . . . .Om and ‘n’ destinations D1, D2 ….. Dn
Let ai be the quantity of product available at Oi
bj be the quantity of product required at Dj.
Cij be the cost of shipping of one unit of product from Oi to Dj
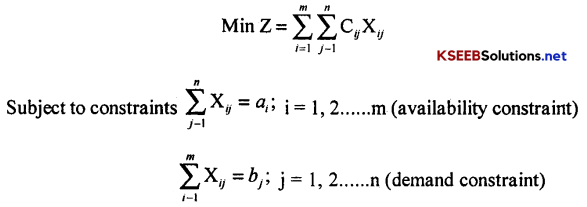
If xij is the number of units to be shipped from Oi to Dj. Then the problem is to determine xij so as to minimize the total transportation cost

And, all xij ≥ 0 i = 1, 2 …………. m & j = 1, 2, ……. n.
Here, a T.P in which (availability) Σai = Σbj (requirement) is called balanced TP
![]()
Definitions:
Feasible solution:
A set of values xij > 0, (i = 1, 2.. m and j = 1, 2 ….. n) is a feasible solution which satisfies:

→ Basic feasible solution(BFS): ‘A feasible solution is said to be a basic feasible solution if the number of non-zero allocations are (m + n – 1)’.
Here (m + n – 1) variables are known as basic variables.
→ Degenerate solution: When the number of positive allocations in any BFS is less than (m + n – 1), then the solution is said to be degenerate.
→ Non-degenerate solution: The number of positive allocations in any BFS is exactly (m + n – 1), then the solution is said . to be non-degenerate.
→ Optimal solution: A feasible solution is said to be optimal if it minimizes the total transportation cost.
→ Finding the initial solution:
An B.F.S. is obtained by :
- Northwest corner rule method (NWCR) ‘
- Matrix minima method(MMM)
→ Northwest corner rule method (NWCR):
In a given T.P. of m-origin, n-destination T.P. with ai-availabilities(i = 1, 2, 3 ……. m) and bj- requirements (j = 1, 2, 3 ……. n)an I.B.F.S is obtained as below:
![]()
Step I:
To start allocating at the cell (1, 1) which is north-west comer cell as: X11 = min (ai, bj)
Step II:
(a) If a1 > b1 next allocation is made at the cell (1, 2) as: X12 = min(a1 – x11, b2)
{in the same row until the factory availabilities are allocated other dealers}
(b) If a1 < b1 next allocation is made at the cell (2, 1) as: X12 = min(a2, b1 – x11)
{in the same column where dealer’s requirement is satisfied from other factories}
(c) If a1 = b1 next allocation is made at the cell(2, 2)as: X22 = min (a2, b2)
{where both dealer and factory are satisfied}
Step III:
The above procedure is repeated until all the availabilities of the origins are allocated to requirement of the different destinations.
Matrix minima method:
(Least/low cost entry method)
In a given T.P. of m-origin, n-destination T.P. with ai-availabilities(i = 1,2,3…m) and bj- requirements (j = 1, 2, 3 …….. n) an I.B.F.S is obtained as below:
![]()
Step I :
Identify the least cost in the cost matrix (called matrix minima) of the T.P. table.
Let Cij be the least cost then allocation is made at the cell (i, j) as:
xij = min (ai, bj)
Step II:
(a) If ai > bj, jth column is deleted and ai is replaced by (ai – xij ), repeat step I:
{here dealer is satisfied so deleted, factory availabilities are more}
(b) If ai < bj ith row is deleted and bi is replaced by (bj – xij), repeat step I.
{here factory availabilities are exhausted}
(c) If ai = bj, ith row and jth column are deleted
{where both dealer and factory are satisfied}
Step III:
The above procedure is repeated until all the availabilities of the origins exhausted
(iii) Game Theory
→ Definition “Whenever there is a situation of conflict and competition between two or more opposing teams, we refer to the situation as a game” (It is science of conflicts)
→ In a game when each player chooses a possible action, then we say that a play of the game has resulted.
Assumptions/properties/characteristics of a competitive game
- There are finite numbers of players (competitors)
- Each player has finite number of course of action
- The game is said to be played when each of the players adopt one of the courses of action
- Every time the game is played the corresponding combination of courses of action leads to transaction (Payment) to each player. The payment is called pay off (gain).
- The gain of one player is exactly equal to the loss of the other
→ n- Person game:- A game in which n players participate is called n-person game.
→ Two-person game:- A game in which only two players participate is called two-person game.
→ Zero-sum game:- A game in which sum of the gains (pay-offs) of the players is zero is called ‘zero sum game’
→ Two-person-zero-sum game:- If in a game of two players, the sum of gain of one player is equal to the sum of loss of other is known as ‘two-person zero-sum game’. Also called as ‘Rectangular Game’.
→ Strategy:- In a game, the strategy of a player is the predetermined rule by which he chooses his courses of action while playing the game.
![]()
→ Pure strategy:- while playing a game, pure strategy of a player is his predetermined decision to adopt a specified course of action irrespective of the course of action of the opponent.
→ Mixed strategy:- While playing a game, mixed strategy of a player is his pre-decision to choose his course of action according to certain pre-assigned probabilities.
→ Optimal strategy:- A strategy of the game which maximizes the gain of one player and minimizes the loss of the other player is called optimal strategy.
→ Maximin:- Maximum of the row minimums in the payoff matrix is called Maximin. max

→ Minimax:- Minimum of the column maximums in the payoff matrix is called minimax.

→ Saddle point:- Saddle point is the position where the maxmin and the minimax coincide – i.e. α = β = v
→ Value of the game:- Common value of maxmin and minimax denoted by ‘V’.
→ Fair game:- If the value of the game is zero, then the game is called fair game otherwise unfair.
I. Solution to a game with saddle point:-
The saddle point of the game is found as follows:
1. The minimum payoff in each row of the payoff matrix is circled as : ○
2. The maximum payoff in each column is boxed as: ▢
→ In the above process, if any payoff is circled as well as boxed, that payoff is the Value of the game (v).
The corresponding position is the saddle point
![]()
→ Indicate the position of the saddle point, and then suggest the strategy for players.
Also, write down the value of the game.
II. Principle of dominance:
→ When Two-person Zero-Sum game has no saddle point, the Maximin-Minimax principle breaks down. In such situation, we use other method called the principle of dominance to find the optimal strategy and value of the game.
→ “If the strategy of a player dominates over the other strategy in all conditions, then the latter strategy can be ignored because it cannot affect the solution in any way”
Rules:
1. If all the elements in a row (say ith row) of a payoff matrix are greater than or equal to the corresponding elements of the other row (say jth row) then ith row dominates jth row , then jth row can be deleted.
2. If all the elements in a column (say rth column) of a payoff matrix are less than or equal to the corresponding elements of the other column (say sth), then rth column dominates sth column. So sth column casn be deleted.
Repeat the process till optimal strategy is obtained.
Note:- To Get a Transpose of a matrix write aij to – aji Rows into columns with sign change.
![]()
(iv) Replacement Problems
Replacement theory deals with the problems of deciding the age at which the old equipments (machine and their spare parts, trucks etc.) are replaced.
Need: New equipments will generally be more efficient and their maintenance cost would be less. As they become old, their efficiency decreases and their maintenance cost (running, operating) increases. Also to determine optimum time for replacement of machine, trucks and equipments.
Following are the needs:
- As the equipment grows older, the maintenance would be costlier.
- New equipments would be more efficient than the old ones.
- Technology of new equipment would be superior to that of the old.
- Production/working cost would be lesser in new equipments.
- Modern equipments are more beautiful and more compact than old equipments.
Replacement of equipments, which deteriorates with age:
Machine and their spare parts, trucks etc. deteriorates with time, their maintenance cost increases and efficiency reduces. Hence, their replacement becomes necessary. Therefore, purchasing cost, resale value, maintenance cost etc. change with time. However, here we are not considering change in the money value.

The Average annual cost is- A(N) = \(\frac{\mathrm{T}}{n}\)
Where P = capital (purchasing) cost of an equipment;
Sn = Resale value (scrap value, salvage cost) of an equipment at age ‘n’
Ci = Maintenance cost at time i = 1, 2,…. n years
The optimal replacement time is that value ‘n’ for which A(n) is least. Ie the equipment is suggested to replace at that period Where the Annual Average Cost A(n) ceases to decrease,
![]()
(v) Inventory Problems
→ An Inventory is a physical stock of goods, which is held for purpose of future production or sales.
→ Inventory may be that of
- Raw materials
- Finished goods
- Semi finished goods.
→ A problem concerning such a stock of goods is Inventory problem. The object of analysis of inventory problem is to decide when and how much to be acquired, so that the cost is minimized and profit is maximized.
Need:
An inventory is essential for the following reasons:-
- It helps in smooth and efficient running of the business.
- It provides adequate and satisfactory service to the customers.
- It facilitates bulk purchase of raw materials at discounted rates.
- It acts as buffer stock in case of shortage of raw materials.
- Inventory is also needed to optimize the cost.
However, the inventory has disadvantages such as, warehouse rent, labour of maintenance loss due to fall in price, interest on capital invested, deterioration of goods etc.
Variables in the inventory problem:
The variables involved in the inventory are of two types:
- Controlled variables .
- Uncontrolled variables
1. Controlled variables:
1. The variables, which can be controlled individually or jointly, are called Controlled variables. They are
- Quantity of goods acquired.
- Frequency or timing of acquisition or replenishment.
- The completion time or stage of stocked items/production of stocked items.
2. Uncontrolled variables: The variables, which cannot be completely controlled are called Uncontrolled variables. These include “Purchase/Capital cost, Carrying cost (Holding / Storage / Maintenance cost), Shortage/Penalty cost and Set-up cost (Replenishment / Ordering cost)”.
![]()
Note: Total inventory cost =Purchasing cost (P) + Setup cost (C3) + Holding cost (C1) + Shortage cost (C2)
Inventory costs These are inventory costs associated with keeping inventories. They are
(a) Purchasing cost (P): It refers to the cost associated with an item whether it is manufactured or purchased. (Also called as Capital cost)
(b) Set up cost (C3): It is the cost of setting up the machines for production or the cost of placing the order for the goods: It includes labour cost, transportation cost etc. It is also called as ordering cost, Replenishment cost, or Procurement cost. Denoted by C3.
(c) Holding cost (C1): It is the cost associated with carrying or holding/ the goods (Inventory) in stock until the goods are sold or used. (It includes rent for space, interest on capital invested, maintenance of records, taxes, insurance and breakages.)
Here Carrying cost (C1) is also the percentages (%) of the capital cost. So C1 = PI
Holding/Carrying cost per unit time per unit good is denoted C.
(d) Shortage cost (C2): The cost associated with delay or inability to meet the demand because of shortage of stock is called shortage cost. Also called as penalty cost-C2.
→ Demand (R):- Demand is the number of units required from the inventory per period. If the demand remains fixed, is called deterministic demand. If the demand varies randomly, is called probabilistic demand
→ Lead time: – The time gap between placing of order and arrival of goods at the inventory is the Lead time (Delivery lag)
→ Stock replenishment:- The rate at which items are added to the inventory to maintain a certain level is known as stock replenishment.
- The quantity of goods acquired in one replenishment is the Order quantity (Q) {Lot size, Run size, Stock replenished}
- The number of times replenishment is done in unit time (year) is the Frequency of replenishment
- The time gap between two replenishments is the Re-order time (t) {Re-scheduling time, production run}
→ Quantity delivered (Depletion): It is the number of units of goods delivered.
→ Time horizon (T): The period over which inventory level is maintained is called Time horizon.
→ The Economic Order Quantity (EOQ): The EOQ is the size of the order for which the aggregate of setup cost and holding cost of the Inventory is minimum.
![]()
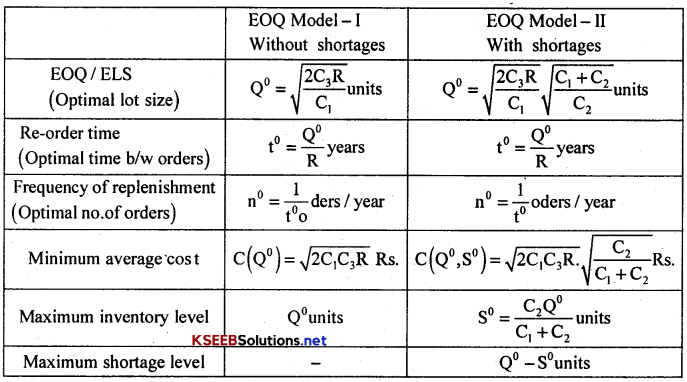
(a) EOQ/ELS model with
- Uniform demand
- Instantaneous production/supply
- Shortages not allowed.
→ Inventory problems where demand is assumed to be fixed and pre-determined are called EOQ/ELS
→ A set of mathematical equations required to solve an Inventory problem is called an Inventory Model.
→ Inventory Model, which are meant for deterministic demand are called EOQ Model or Economic Lot Size (ELS) model.
The Assumptions for this Model are:
- Demand is deterministic and uniform
- Production or stock replenishment is instantaneous
- Shortages are not allowed
- Lead Time is zero
- Setup cost is Rs.C3 per cycle (production run)
- Holding cost is C1 per item per year
- Time period for maintaining of the level of Inventory is 1 year
Notations:
- Q – Lot size (run size, Quantity replenished, order quantity)
- P – Purchase/Capital cost,
- R – Demand Rate,
- S – Initial Level of Inventory,
- t – Time interval between two consecutive replenishment (Rescheduling time)
- n – Number of replenishment per unit time
- C1 – Carrying (Holding cost, Storage cost, Maintenance cost) per unit good per unit time
- C2 – Shortage cost/Penalty cost per unit good per unit time
- C3 – Setup/ordering cost per production run
- I – Carrying/Holding Cost per Rupee per unit time,
- C (Q) or C(Q°, S°) – Average cost per unit time.
![]()
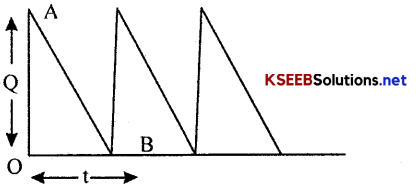
Diagram of EOQ Model-I without shortages

Here the initial level Q of the inventory depletes in time t at the rate R to the zero level. After time t, then Inventory is replenished by Q units and the cycle continuous. Here ?OAB indicates the Inventory carried.
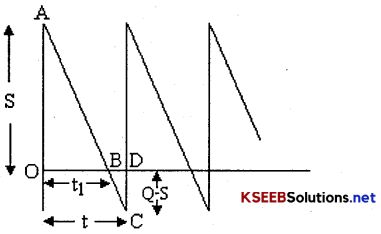
Diagram of EOQ Model-II with shortages

Here at the time of replenishment, there would be a shortages (Q-S) units and so, the level of inventory would be S. This level depletes in time t1 to zero. Here ?OAB represents the Inventory carried and ∆BCD represents the shortage carried.
