2nd PUC Economics Notes Chapter 4 Production and Cost

Karnataka 2nd PUC Economics Notes Chapter 4 Production and Cost

→ Meaning of Production: Production refers to a transformation of input into output. For example raw cotton is made into clothes.

→ Production Function: Production function refers to a functional relationship between input and output. It is a technical relation between factors of production and output produced. Production function deals with combination of inputs to produce more output. The production function can be written as follows:
Q = f (R, L, K, O ) where Q is quantity produced, f is function, R refers to Land, L to Labour, K- capital, O – organization.

2nd PUC Economics Notes Chapter 4 Production and Cost

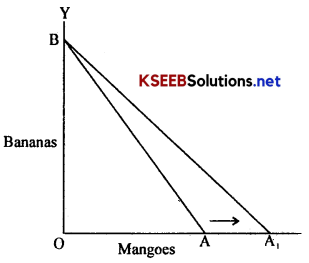
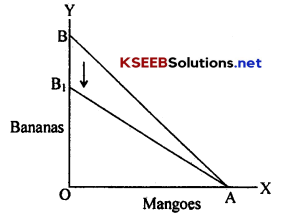
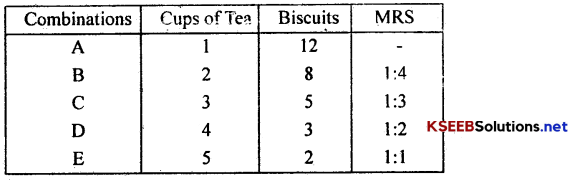
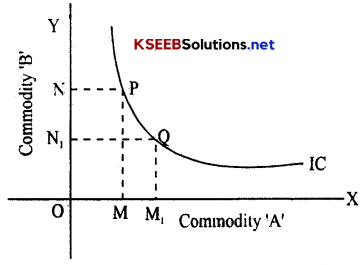
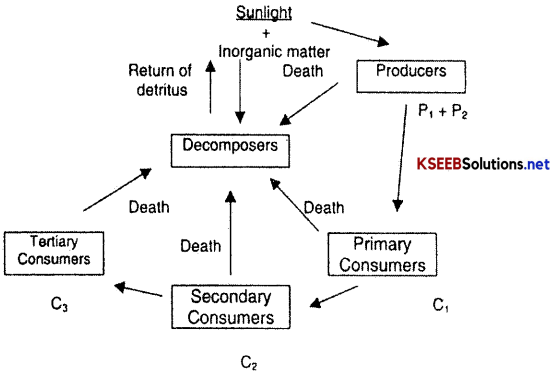
→ Marginal Rate of Technical Substitution (MRTS): MRTS refers to the rate at which one input is substituted for another input without altering the level of output. For example units of capital are replaced by an unit of labour to produce the same level of output.

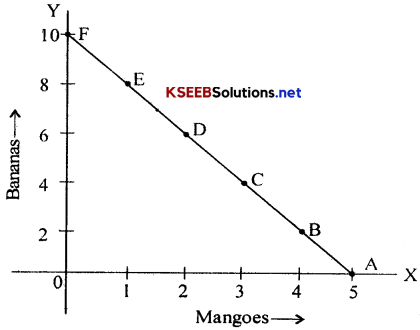
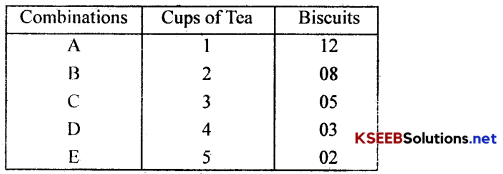
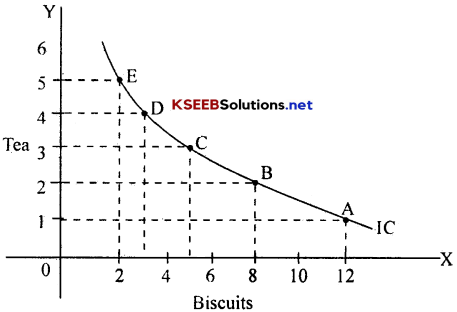
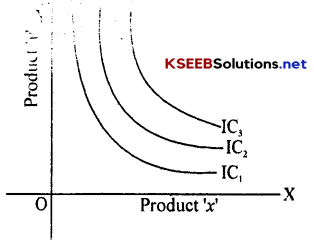
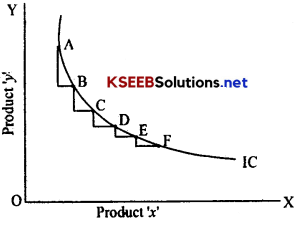
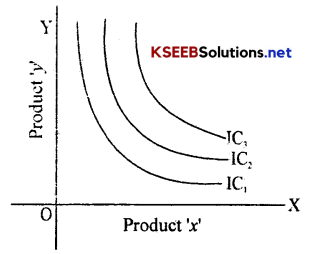
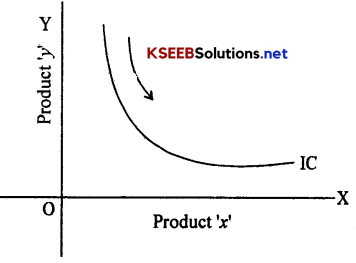
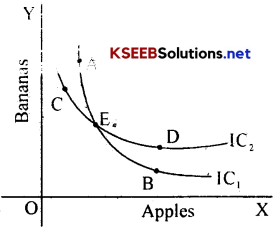
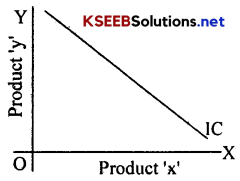
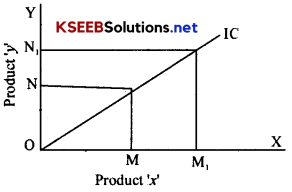
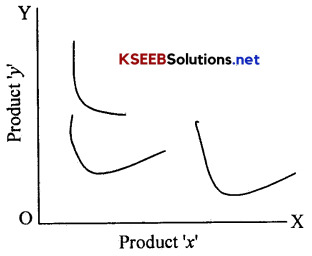
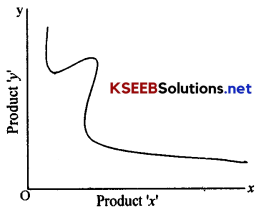
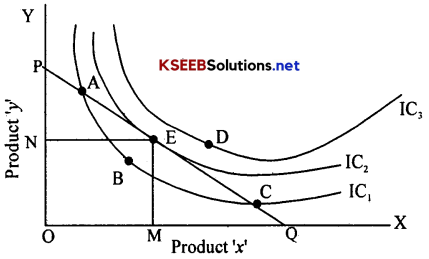
→ ISO Quants (ISO-Product Curve): An Iso-quant is a curve on which the various combinations of labour and capital show the same level of output. It also refers to the locus of all possible combinations of two inputs (Labour and Capital) which result in the same level of output.

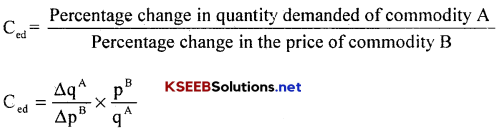
→ Total Product (TP): It refers to the aggregate output produced with the help of factor inputs during a particular period of time. It is obtained by adding the Marginal product contributed by each input.

→ Average Product(AP): Average product is an unit of output which is produced per unit input. It is calculated by dividing the Total Product with the help of variable inputs.
AP = \(\frac{\mathrm{TP}}{\mathrm{L}}\) where TP is Total product and L variable factor input (e.g. Labour)

→ Marginal Product (MP): Marginal product refers to additional unit of output produced with the help of additional unit of input of labour or capital. We can calculate MP with the help of the following formula:
MP = TPn – TPn – 1
Where, MP is marginal product, TPn is the total product of ‘n’ units, and TPn – 1 is the total product of the previous unit of output.

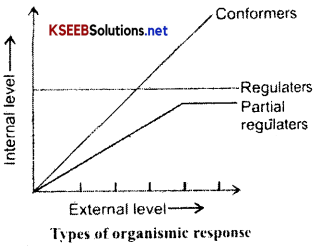
→ Law of Variable Proportions (LVP): LVP refers to input-output relationship, when the output is increased by varying the quantity of one input. This law operates in short period when all the factors of production cannot be increased or decreased simultaneously. The producer can enhance the output by increasing only one variable input by keeping other factors fixed. So, there will be change in proportion between Variable and Fixed Inputs. This is called as the Law of Variable Proportions.

2nd PUC Economics Notes Chapter 4 Production and Cost

Long run production – Returns to Scale:

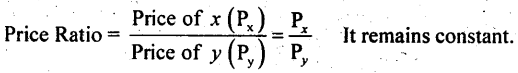
We know that, in the long run all factor inputs are variable. The returns to scale explain the relationship between input and output over a long period. They study about the changes in output as a consequence of changes in all the inputs. This can be represented as follows:
Q = f(X1, X2, )

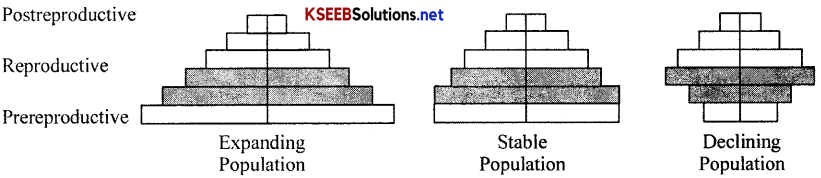
Stages of Returns to Scale: Returns to scale may be

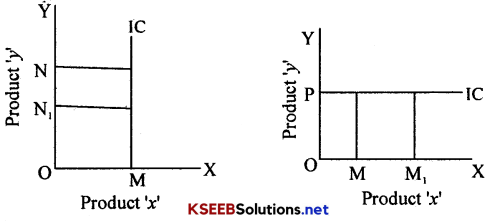
  1. Increasing Returns to Scale,
  2. Constant Returns to Scale
  3. Diminishing Returns to Scale.

These returns to scale can be seen in Total Product which is result of changes in all inputs.

1. Increasing Returns to Scale: Here, the output increases in a greater proportion than the increase in inputs. When a firm expands, increasing returns to scale are obtained in the beginning. For example, if there is 20% increase in inputs, the output increases by 30%. The increasing returns to scale also is a result of indivisibility of factors. Some factors are available in large and can be utilized with utmost efficiency at a large output.

2. Constant Returns to Scale: The constant returns to scale exists when the output increases in the same proportion with the increase in inputs. For example, if a producer increase inputs by 25%, the Total product increases by 25%. Here the Total Product increases at constant rate. It has been found that an individual firm passes through a long phase of constant returns to scale in its lifetime.

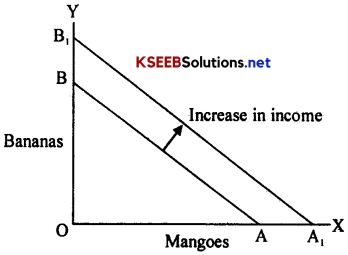
3. Diminishing Returns to Scale: Also known as decreasing returns to scale operate when output increase in a smaller proportion with an increase in all inputs. For example, if a producer increases all inputs by 20%, the Total product increase in 15%. Diminishing returns to scale eventually occur because of increasing difficulties of management, coordination and control. When the firm has expanded to a very large size it is difficult to manage it with the same efficiency as previously. So, the diminishing returns to scale exist.

Internal Economics: The internal economics (advantages of large scale production) arise within the firm when it increases its scale production by increasing all inputs.

External Economics: These are the benefits which a firm gets when the entire industry is expanded. They accrue to all the firms as a result of expansion in the output of whole industry and they are not dependent on the output level of individual firms. The firms get these economics from outside because of expansion of the industry.

2nd PUC Economics Notes Chapter 4 Production and Cost

Cost of Production or Production Cost:

→ Cost of production refers to the expenses incurred by the producer to produce various goods and services. It includes all those expenditure made by a firm or industry to manufacture products. To produce any product an entrepreneur (producer) has to use factors of production like Land, Labour, Capital and Organization. In order to make use of all these, one has to spend money which is termed as cost.

Cost Concepts: – Explicit Costs and Implicit Costs:
→ Explicit costs are those expenses of a producer which are spent on obtaining factors of production to manufacture products. Example rent, wages, raw material cost, transportation, power expenses etc. These expenses are shown in books of accounts.

→ Implicit costs are those which are not considered by the producer as he owns himself few factors of production. According to Prof.Lefitwitch, “Implicit costs are cost of self owned and self employed resources.” These expenses are not shown in books of accounts.

→ Classification of Costs:

  • Short run Costs
  • Long run Costs.

Short run Costs:
In the short period, the relationship of cost with output is different from that for a long period. Generally the cost of production in the short period will be relatively higher than in the long period. This is because of the following features of short period.

  • In the short period, the capacity of the firm is fixed.
  • Among the factors of production, fixed factor remaining constant and only variable factors can be altered with the change in the output.

2nd PUC Economics Notes Chapter 4 Production and Cost

The short run costs include the following:

1. Fixed Cost or Supplementary Cost:
These are the costs which are incurred on fixed factors of production. The amount of expenditure spent on fixed factors is unaltered in the short run. Therefore fixed costs are to be incurred by a firm even when the output is zero. So, fixed cost is called as unavoidable contractual cost. Prof. Marshal calls it as Supplementary cost, they include the cost on factor like land, building, machinery, superior type labour, interest on capital, administrative expenses, salary of the permanent employees etc. All these are also called over head cost.

2. Variable Cost:
Variable costs are the expenses incurred on the variable inputs like raw materials, ordinary labours, electricity etc. This cost is direct and proportionate with the level of output i.e. when the output is zero, variable cost is nil. Prof. Marshall called variable cost as Prime cost or direct cost. These costs get altered according to change in output.

Difference between Variable Cost and Fixed Cost

Fixed Cost  Variable Cost
1. It does not change with the change in output.  1. It changes with the change in output.
2. It is short run cost.  2. It is both short and long run cost
3. It is spent on fixed factors of production.  3. It is spent on variable factors.
4. It does not depend on the level of output.  4. It depends on level of output.
5. Example for Fixed costs are rent, insurance premium, machineries etc.  5. Example for Variable costs are cost of raw materials, power, transport, etc.

2nd PUC Economics Notes Chapter 4 Production and Cost

Nature and Behaviour of Cost Curves in the Short Run:

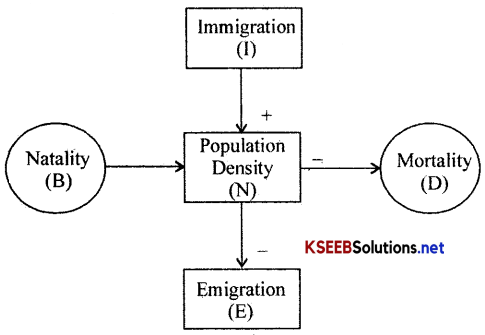
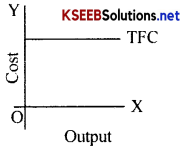
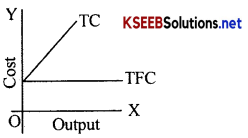
1. Total Fixed Cost (TFC):
It refers to the total money expenses incurred on all the fixed factors in the short run. TFC remains constant at all levels of output. Therefore the total fixed cost curve is horizontal straight line parallel to x axis above the origin which indicates that it is never zero.
2nd PUC Economics Notes Chapter 4 Production and Cost 1

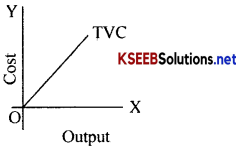
2. Total Variable Cost (TVC):
It refers to the total money expenses incurred on the variable factor inputs in the short-run. Total variable cost is the direct cost of the output because it increases along with the output and remains zero when the output is zero. So, the TVC curves starts from the origin and rises sharply in the beginning, gradually in the middle and stretches again sharply in the end. The nature of this slope is in accordance with the law of variable proportion.
2nd PUC Economics Notes Chapter 4 Production and Cost 2

3. Total Cost (TC):
It is the aggregate money expenditure incurred by the firm on all the factors to produce a given quantity of output. TC varies in the same proportion as total variable cost because the total fixed cost is constant. The TC curve slope upwards from left to right, above the origin, indicating that, it includes total fixed cost and total variable cost.
TC = TFC + TVC
2nd PUC Economics Notes Chapter 4 Production and Cost 3

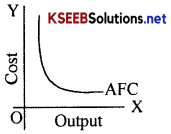
4. Average Fixed Cost (AFC):
It is the fixed cost per unit of output. In other words, it is average expenses incurred on a single unit of output produced. AFC and output are inverse relation i.e. AFC will be higher when the output level is less and as the output goes on increasing, AFC starts reducing. When it is represented in the diagram, AFC curve will have a negative slope which falls very stiffly in the beginning and later on becomes parallel to the X axis. This shows that it is never zero as TFC is never zero.
The Average Fixed Cost is obtained by dividing Total Fixed Cost by the output. AFC = TFC/output.
2nd PUC Economics Notes Chapter 4 Production and Cost 4

2nd PUC Economics Notes Chapter 4 Production and Cost

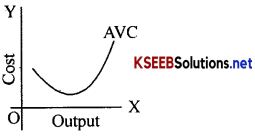
5. Average Variable Cost (AVC):
It is a variable cost per unit of output. It can be calculated by dividing total variable cost by the total units of output. When this cost is graphically represented, we get a ‘U’ shaped AVC, which shows that the cost will be less as the number of units produced.increase, this is because as the number of variable inputs are added in a fixed plant the efficiency will increase and vice versa.
AVC = TVC/output or AVC = AC – AFC
2nd PUC Economics Notes Chapter 4 Production and Cost 5

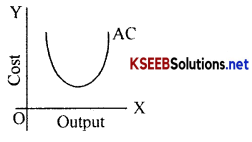
6. Average Cost (AC):
It is the cost per unit of output produced. It is obtained by dividing total cost by the total output produced i.e. AC = TC/Q or it is also obtained by adding AFC and AVC. If the AC is graphically represented, we get a U shaped curve because of the operation of law of variable proportions. The short run AC curve is also called as ‘Plant Curves’ because it indicates the optimum utilization of a given plant (Industry) capacity.
2nd PUC Economics Notes Chapter 4 Production and Cost 6

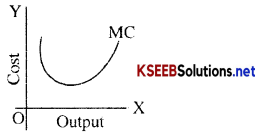
7. Marginal Cost (MC):
It is an additional cost incurred to produce an additional output. In other words it is the net additions to the total cost when one more unit of output is produced.
MC = TCn – TCn – 1
(Where TCn = Total Cost of ‘n‘ selected units of output and TCn – 1 is total cost of the previous output)
2nd PUC Economics Notes Chapter 4 Production and Cost 7

Other types of costs:

1. Money Cost and Real Cost:
Private cost: Private costs, also referred to as Money costs, include all those expenses of’ producer expressed in terms of money. Example: Costs on rent, power, raw material, transport, expenses etc.

Real Cost: When cost is expressed in terms of physical or mental efforts put in by a person in the making of a commodity, it is called as real cost. It includes efforts, services and sacrifices put in by different factors of production. The concept of Real Cost was introduced by Prof. Alfred Marshall.

2. Explicit Cost and Implicit Cost:
Explicit cost is the external costs incurred by the producer on all those factors which is either hired or purchased by him.

Implicit cost: Implicit costs are imputed cost which is incurred on all those factors which are owned by t he producer himself. These costs are only book cost which is only accounted and not actually incurred. For example the salary of the owner, the depreciation charges etc.

2nd PUC Economics Notes Chapter 4 Production and Cost

3. Opportunity Costs:
The concept of opportunity cost was popularized by an American writer -Prof.Heberlour. It is the cost measured in terms of revenue earned by the factor when it is employed in some other alternative jobs. In other words it is the cost of displaced alternative. While calculating opportunity cost the profit earned from the best alternative employment sacrificed is taken into consideration. Therefore, opportunity cost is also called as Alternative Cost. If the factor decision doesn’t involve any sacrifice then its opportunity cost is zero.
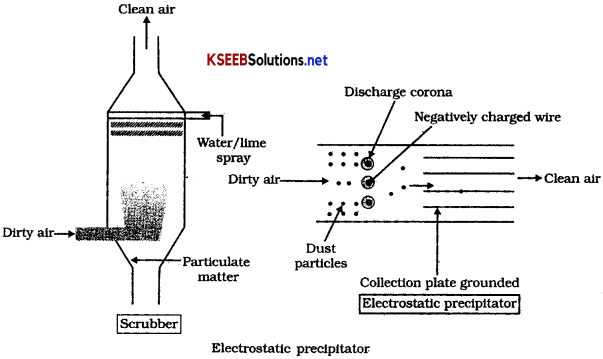
4. Social cost:
The Social Costs are those expenses of the Government or Private Sector to produce goods and services for the entire society or economy. For example, to combat pollution, deforestation, flood etc, Government and NGO spend huge amount of money. This may be termed as Social Cost.

2nd PUC Economics Notes

2nd PUC Economics Notes Chapter 3 Demand Analysis

Karnataka 2nd PUC Economics Notes Chapter 3 Demand Analysis

The Concept of Demand:

→ The concept ‘demand’ refers to the quantity of a good or service that a consumer is willing and able to purchase at various prices, during a period of time. It is to be noted that demand in Economics is something more than desjre to purchase though desire is one of the elements of demand. For example, a beggar may desire food, but due to lack of ability to purchase his demand is not effective.

→ So, the concept of demand includes three elements viz., Desire to buy, ability to pay and willingness to pay. Alfred Marshall has developed the theory of demand analysis.

→ According to Alfred Marshall, Demand is “the quantity of a product that a consumer purchases in a market at a particular price and at a particular time.

2nd PUC Economics Notes Chapter 3 Demand Analysis

Determinants of Demand:

There are many factors which influence the demand of consumers: They are:

  • Price of the commodity which the consumer is going to buy.
  • Price of related products (substitutes).
  • Level of income of consumers.
  • Tastes and preferences of consumers.
  • Demonstration effect – an individual’s demand for a car is influenced by his friend’s or neighbour’s new car.

Demand Function:

→ The Demand Function refers to a functional relationship between quantities demanded and its determinants. It can be expressed as follows:
Qd = f(P, Pr, Y, T, ……..)

→ Where Qd stands for Quantity demanded, ‘f is function, P is Price of commodity, Pr – price of reiated(substitutes, Y is income of consumers, T is tastes and preferences of consumers.

→ As the Price plays a predominant role in determining quantities demanded, we can rewrite the demand equation as follows:
Qd = f (P)

→ where Qd is demand, ‘f’ is function and P is price of the product.

→ The demand function, in the form of equation can be represented as follows:
Qd = a – bp

→ Where Qd is quantity demanded, ‘a’ and ‘b’ are constants. It is linear (i.e., when represented in graph we get a straight line). Here ‘a’ represents maximum limit and ‘-b’ represents slope nf the function. So, the slope of demand is downward. That means there is inverse relationship between price and quantities demanded.

2nd PUC Economics Notes Chapter 3 Demand Analysis

For example, Qd = 40 – 4p
Problem: If Qd = 40 – 4p represents demand for a good in a market and if the price of potato per k.g during different days are Rs.3, Rs.4, Rs.5, Rs.6 and Rs.7, calculate the quantities demanded.
When price is Rs.3
Qd = 40 – 4p
= 40 – 4(3)
= 40 – 12
= 28

When price is Rs.4
Qd = 40 – 4p
= 40 – 4(4)
= 40 – 16
= 24

When price is Rs.5
Qd = 40 – 4p
= 40 – 4(5)
= 40 – 20
= 20

When price is Rs.6
Qd = 40 – 4p.
= 40 – 4(6)
= 40 – 24
= 16

When the price is 7
Qd = 40 – 4p
= 40 – 4(7)
= 40 – 28
= 12

2nd PUC Economics Notes Chapter 3 Demand Analysis

Individual Demand Schedule

Price- P (in Rs.) Demand (Qd) (in Kgs)
3 28
4 24
5 20
6 16
7 12

The Law of Demand:

→ The law can be explained in the following manner: “Other things being equal, a fall in price leads to expansion in demand and a rise in price leads to contraction in demand”.

→ According to Prof.Samuelson, the law of demand states that ‘People buy more at lower prices and buy less at higher prices, other things remaining the same’.

Individual demand schedule:
→ It is that demand schedule which represents the quantities demanded by an individual consumer at different levels of price.

2nd PUC Economics Notes Chapter 3 Demand Analysis

Individual Demand Schedule

Price- P (in Rs.) Demand (Qd) (in Kgs)
3 30
4 25
5 20
6 15
7 10

→ In the above individual demand schedule, the consumer is purchasing different quantities at different price levels. At Rs.3 he buys 28 kgs, at Rs.4, 24 kgs are bought arid so on. As the price increases, the quantities demanded falls.

→ Demand Curve: “The graphical presentation of the demand schedule is called demand curve.

2nd PUC Economics Notes Chapter 3 Demand Analysis 1

→ In the above diagram, price is measured along Y axis and quantities demanded are measured along X axis. The various points on Demand line represent respective quantities demanded. For example, quantity demanded is 20 at the price Rs.5. (Point C). .

→ The demand curve slopes downwards from left to right. It shows that the rate at which demand changes with respect to change in pride. As there is inverse relationship between price and quantities demanded, the Curve is negatively sloped.

2nd PUC Economics Notes Chapter 3 Demand Analysis

Why does Demand Curve slope downwards?
In order to represent the inverse relationship between price and demand, the demand curve must slope downwards. Apart from this basic reason, there are many other factors which make the demand curve to slope downwards. They are as follows:

1. Operation of the law of Diminishing Marginal Utility:
The law of DMU states that as the consumer acquires larger quantities of any commodity, the additional units of the same product will give him lower utility, and as such he sets a less value for the additional unit. The law of demand states that in order to induce the consumer to buy more, lower price must be offered.

2. Operation of the law of Equi- Marginal Utility:
This law states that utility of the product must be equal to its price in general. As price falls, the equality between the two will be disturbed and in order to re-establish this equality the consumer buys more. Now utility comes to the level of reduced price. Hence, as price falls, a consumer buys more.

3. Income effect:
A change in demand as a result of change in income is called as Income effect. As price falls, the real income of the consumer increases. With this increased real income (gets more purchasing power with more money in his hands), he buys more.

4. Substitution effect:
When the price of one product falls, it become cheaper when compared to other products for which the price remains constant. Hence, a consumer will substitute low priced product to high priced products. The result is that demand for a product rises as price falls.

5. Price Effect:
When the change in quantities demanded is caused by the change in price, . it is called as Price effect. When the price of a product falls, it becomes cheaper and consumer buys more of that and vice versa.

2nd PUC Economics Notes Chapter 3 Demand Analysis

Normal goods and Inferior goods:

Normal goods are those goods for which the demand increases with increase in income of consumers and decrease with decrease in consumers’ income. In case of normal goods, there will be a direct relationship between income of consumers and quantities demanded.

Inferior goods are those goods for which the demand decreases with the rise in income of consumers. If the demand decreases for a product as a result of increase in income of consumers, such products are inferior goods. Here, when the price of goods fall, the consumer’s real income gets increased so that he can go for superior goods with the Same money income. There is inverse relationship between quantities demanded and income of consumer. These goods are also called as Giffen goods.

Substitutes and Complementary goods:

→ The competing goods or substitutes are alternative products which can be used easily in place of another to satisfy a particular need of consumer. For example, coffee and tea, ink pen and ball pen etc,. In case of substitutes, a fall in price of one commodity leads to a fall in the quantity demanded of another commodity. There is direct relationship between price of substitute and quantity demanded of a product.

→ Complementary goods are those goods which are consumed together to satisfy our wants. For example, vehicle and petrol, shoes and socks, bat and ball etc. If the price of petrol increases the demand for vehicle falls and vice versa. There is inverse relationship between price of a product and demand for its complementary product.

2nd PUC Economics Notes Chapter 3 Demand Analysis

Movements along the demand curve – Expansion and contraction of demand:

It shows the movement of quantities demanded due to changes in price level which can be represented on demand curve. When the price becomes less, more quantities are demanded, hence it is called as Expansion of Demand and when the price rises, there will be fall in quantities demanded, it is called Contraction of Demand. When the same is represented on graph, we get movement on the same demand line/curve. Thus any changes in price leads to movements along the demand line as shown below.

2nd PUC Economics Notes Chapter 3 Demand Analysis 2

In the above diagram, we measure quantities demanded along X-axis and price along Y-axis. When the price rises from OP to OP2 the quantities demanded will be reduced from OM to OM,, it is called contraction of demand and when the price falls from OP to OP1 the quantities demanded gets expanded from OM to OM1, it is called expansion of demand.

Shift in demand curve-Increase and Decrease in Demand:
The increase and decrease in demand are caused by all the determinants of demand except price. When there is a change in consumer’s income, tastes and preferences, price of related goods, there may be increase or decrease in the Demand.

Increase in Demand: When the income of consumer increases, the demand for the product increases and there will be shift in demand line towards right. For normal goods, the demand curve shifts to the right. In the diagram given below, D1 represents shift in demand line towards right indicating increase in demand.

2nd PUC Economics Notes Chapter 3 Demand Analysis

Decrease in Demand: When the price of related goods rise, the demand for the product falls and the demand curve shifts towards left. For example, if there is rise in price of petrol, the demand for vehicle decreases, representing backward shift of demand line In the diagram below, D2 represents shift in demand towards left indicating decrease in demand.

2nd PUC Economics Notes Chapter 3 Demand Analysis 3

Market Demand: The market demand refers to the aggregate demand function of an entire market. It is said that, the market demand for a product at a particular price is the total demand of all the consumers in the market taken together.

Market Demand Schedule: The Market Demand Schedule includes the demand schedules of individual consumers. For example, the following market demand schedule is derived from two individuals, viz., A and B

2nd PUC Economics Notes Chapter 3 Demand Analysis 4

Market demand curve: It is derived from individual demand curves just by adding individual demand curves horizontally. It is also called as horizontal summation to obtain Market demand curve.

2nd PUC Economics Notes Chapter 3 Demand Analysis 5

2nd PUC Economics Notes Chapter 3 Demand Analysis

Elasticity of Demand

Meaning & Definition:
→ Elasticity of demand is generally defined as the responsiveness or sensitiveness of demand to a given change in the price of commodity.

→ It refers to the capacity of demand either to stretch or shrink to a given change in price.

Concepts of Elasticity of Demand:
I. Price Elasticity of Demand
II. Income Elasticity of Demand
III. Cross Elasticity of Demand.

I. Price Elasticity of demand:
→ In the words of Prof. Stonier & Hague, “Price elasticity of demand is a technical term used by economists to describe the degree of responsiveness of the demand for a good to a change in its price.

→ It is measured by using the following formula.
2nd PUC Economics Notes Chapter 3 Demand Analysis 6

→ Here, ∆q stands for change in quantity, ∆p for change in price, ‘p’ is the initial price and ‘q’ is initial quantity.

2nd PUC Economics Notes Chapter 3 Demand Analysis

Problem: If the price of Potato rises from Rs.20 to Rs.30 per kg and its quantity demand decreases from 10 to 5 kgs, calculate the PED.
Solution:
∆q = 5 – 10 = -5; ∆p = 30 – 20 = 10; then PED is ,
PED = \(\frac{\Delta q}{\Delta p} \times \frac{p}{q}\)
PED = \(\frac{-5}{10} \times \frac{20}{10}\) = -0.5 × 2 = -1
⇒ Price Elasticity = – 1.

Classification of Price Elasticity of Demand:

On the basis of the degree of price elasticity for different goods, we classify PED as follows:

1. Perfectly Elastic Demand:
In this case, a very small change in price leads to an infinite change in demand. The demand curve is a horizontal curve and parallel to x axis. The numerical co-efficient of price elasticit of demand is unlimited or infinity. Ped = ∞
2nd PUC Economics Notes Chapter 3 Demand Analysis 7

2. Perfectly Inelastic Demand:
In this case, whatever may be the change in price, quantity demanded will remain perfectly constant. The demand curve is a vertical straight line and parallel to Y axis. Quantity demanded would be 10 units, irrespective of price changes from Rs. 10.00 to Rs.2.00. Hence, the numerical co-efficient of perfectly inelastic demand is zero. Ped = 0
2nd PUC Economics Notes Chapter 3 Demand Analysis 8

2nd PUC Economics Notes Chapter 3 Demand Analysis

3. Relatively Elastic Demand :-More elastic demand.
In this case, a slight change in price jeads to more than proportionate change in demand. One can notice here that a change in demand is more than that of change in price. Hence, the elasticity is greater than one. For e.g., price falls by 3% and demand rises by 9%. Hence, the numerical co-efficient of demand is greater than one.
2nd PUC Economics Notes Chapter 3 Demand Analysis 9
Here the percentage change in quantities demanded is greater than percentage change in price i.e., ∆q > ∆p or M M1 > P P1.

4. Relative Inelastic Demand:-Less Elastic Demand.
In this case, a large change in price, say 8% fall in price, leads to less than proportionate change in demand; say 4% rise in demand. One can notice here that change in demand is less than that of change in price. This can be represented by a steeper demand curve. Hence, elasticity is less than one. (PED<1)
2nd PUC Economics Notes Chapter 3 Demand Analysis 10
Here the percentage change in quantities demanded will be less than percentage change in price, i.e., ∆q < ∆p or M M1 < P P1.

5. Unitary or Equal Quantity, Elastic Demand:
In this case, proportionate change in price leads to Equal proportionate change in demand. For e.g., 5% fall in price leads to exactly 5% increase in demand: Hence, elasticity is equal to unity. It is possible to come across unitary elastic demand but it is a rare phenomenon.
2nd PUC Economics Notes Chapter 3 Demand Analysis 11
Here, the percentage change in quantities demanded will be equal to the percentage change in price, i.e., ∆q – ∆p or M M1 = P P1.

Out of five different degrees the first two are theoretical and the last one is a rare possibility. Hence, in all our general discussions, we make reference only to the two terms- relatively elastic demand and relatively inelastic demand.

2nd PUC Economics Notes Chapter 3 Demand Analysis

Determinants of Price Elasticity of Demand:

1. Nature of the Commodity:
→ In case of comforts and luxuries, demand tends to be elastic because people buy those more only when their prices are low. For e.g. TV sets.

→ In case of necessaries, demand is inelastic because whatever may be the price people have to buy and use them. For e.g. Rice.

2. Existence of Substitutes:
→ If a product has substitutes, demand tends to become elastic because people compare the prices of substitute goods and cheaper products are purchased. For eg. Blades, Soaps.

→ If a product has no substitutes, demand becomes inelastic because in that case whatever may be the price, people have to buy them. For e.g. Onion.

3. Durability of the commodity:
→ If a product is perishable or non durable, demand tends to be inelastic because people buy them again and again.

→ If a product is durable, demand tends to be elastic because people buy them occasionally.

4. Number of uses of a commodity:
→ If a product has multiple uses, demand tends to become elastic because, with a fall in price, the same product can be used for many purposes. For e.g. Electricity, coal etc.

→ If a product has only one use, the demand becomes inelastic because people have to buy them for a specific single purpose whatever may be the price. For e.g. All eatables, seeds, fertilizers, pesticides etc.

2nd PUC Economics Notes Chapter 3 Demand Analysis

5. Possibility of postponing the use of a product:
→ If there is a possibility to postpone the use of particular product, demand tends to become elastic. For eg. Buying a scooter, motorcycle, TV sets etc.’people generally buy these articles when they are cheaper.

→ If it is not possible to postpone, demand tends to become inelastic. In this case, whatever may be the price, people have to buy them. For e.g. Medicine.

6. Level of income of people:
→ Generally speaking, demand will be elastic in case of the poor people because even a small change in price will affect the demand for various products.

→ On the other hand, demand will be inelastic in case of rich people because they are ready to spend any amount on buying a product.

7. Habits:
→ If people are not habituated for the use of certain products, then demand tends to be elastic. If products are cheaper, they buy more and if they become costly, they may buy less or may not buy them at all.

→ When people are habituated for the use of a commodity, they do not care for price changes over a certain range. For eg. Cigarettes, liquor etc. In that case, demand tends to become inelastic.

8. Complementary goods:
→ Goods which are jointly demanded are inelastic in nature. For e.g., pen and ink, vehicles petrol etc. This is because, if people buy one product, they have to buy the supplementary products also without which they cannot make use of the first item.

→ Demand tends to be elastic in case of independent products. For eg., biscuits, chocolates, ice-creams etc. In this case, consumption or use of a product is not linked to any other products. Hence, they may or may not buy a product.

II. Income Elasticity of demand:
→ Income elasticity of demand may be defined as the ratio or proportionate change in the quantity demanded of a commodity to a given proportionate change in the income. In short, it indicates the extent to which demand changes with a variation in the consumers income.

→ The following formula helps to measure YED.
2nd PUC Economics Notes Chapter 3 Demand Analysis 12

→ Here, ∆q stands for change in quantity, ∆y is change in Income of consumer, ‘y’ is the initial income and ‘q’ the initial quantity.

2nd PUC Economics Notes Chapter 3 Demand Analysis

Problem: Calculate the income elasticity of demand when income of consumer increases from Rs.20,000 to Rs.24,000 and his demand for vegetables rise from 10 to 20 kgs.
Solution:
∆q = 20 – 10 = 10; ∆y = 24,000 – 20,000 = 4000;
2nd PUC Economics Notes Chapter 3 Demand Analysis 13
So, Income Elasticity of Demand is greater than one.

III. Cross Elasticity of Demand:
→ It may be defined as the proportionate change in the quantity demanded of a particular commodity in response to a change in the price of another related commodity. In the words of Prof. Watson “Cross elasticity of demand is the rate of change in quantity associated with a change in the price of related goods”. Generally it arises in case of substitutes and complements.

→ The formula for calculating cross elasticity of demand is as follows:
2nd PUC Economics Notes Chapter 3 Demand Analysis 14

→ Where Ced is Cross Elasticity of Demand, ∆qA – change in quantity demanded of product A, ∆pB change in price of product B, pB – Original or initial price of B, and qA orginal or initial quantity of A.

2nd PUC Economics Notes Chapter 3 Demand Analysis

Problem: When the price of coffee in a college canteen rises from Rs.10 to Rs.15, the demand for Tea increases from 80 to 120 cups per day (Price of tea remains at 10) Calculate Cross Elasticity of Demand (Ced).
Solution:
∆qA = 120 – 80 = 40; ∆pB = 15 – 5 = 5; pB = 10; qA = 80
Therefore Ced = \(\frac{\Delta q^{A}}{\Delta p^{B}} \times \frac{p^{B}}{q^{A}}\)
= \(\frac{40}{5} \times \frac{10}{80}\) = 1
Therefore, the Cross Elasticity of demand is equal to one (Ced = 1).

2nd PUC Economics Notes

2nd PUC Economics Notes Chapter 2 Theory of Consumer Behaviour

Karnataka 2nd PUC Economics Notes Chapter 2 Theory of Consumer Behaviour

Utility is the calculation of want satisfying power of a particular commodity before consumption where as a consumer gets satisfaction only after consumption or usage of the same. Anything that satisfies human wants, possesses utility. For example food, cloth, pen, paper, T.V, Mobile etc. People keep such goods to satisfy their wants.

Features of Utility:
1. ‘Utility’ should be differentiated from ‘Satisfaction’. Here, utility refers to an expected satisfaction and satisfaction is the actually realized one.

2. Utility is not usefulness always: A product may satisfy a person’s desires but it may not be useful or beneficial to them, it may be harmful (like tobacco, liquor).

3. Utility is neutral in ethics: That means it does not throw’ any light on moral principles while ‘ satisfying a specific need of a consumer.

4. Utility is subjective: It varies from person to person, time to time and from place to place

2nd PUC Economics Notes Chapter 2 Theory of Consumer Behaviour

Cardinal and Ordinal Approaches:

1. Cardinal Approach: This approach to the theory of demand was developed by neo-classical economists like Marshall and Pigou. The basic idea of this approach is that a consumer buys a certain commodity or service because of its utility and due to the power that it possesses to satisfy his want. Here the utility can be measured cardinally. That means it is possible to know exactly the number of units of utility that a commodity or service contains for the consumer. The unit of measurement of utility may be called a ‘util’.

2. Ordinal Approach: This approach says that the utility cannot be measured in terms of numbers but it can be ranked like 1st, 2nd, 3rd so on. This was developed by the economists like J.R.Hicks, and Slutsky.

Concepts of Utility:

Initial Utility: It refers to that utility which is derived from the consumption of first unit of a product.

Total Utility: Utility derived from the consumption of all the goods and services. The Total utility can be represented as follows:
TU = U1 + U2 + U3 + U4 + …………….. Un. or TUn = ΣMUn

Marginal Utility: It is the additional utility derived from the consumption of additional unit of a product. In other words, it is the addition to the Total Utility obtained from the consumption of one more unit. It is obtained as follows:
MUn = TUn – TUn – 1,

Where MUn – Marginal utility of ‘n’ units, TUn – Total utility of ‘n’ units, and TUn – 1 – Total utility of all the previous units.

Law of Diminishing Marginal Utility:

One of the most important propositions of the cardinal utility approach to demand was the Law of Diminishing Marginal Utility. German Economist Gossen was the first to explain it. Therefore, it is called Gossen’s First Law.

Definition:
According to Alfred Marshall, “The additional benefit which a person derives from a given increase of a stock of a thing diminishes, other things being equal, with every increase in the stock that he already has”.

This law simply tells us that, we obtain less and less utility from the successive units of a commodity as we consume more and more of it.
2nd PUC Economics Notes Chapter 2 Theory of Consumer Behaviour 1
In the diagram, the horizontal axis shows the units of apples and the vertical axis measures the MU and TU obtained from the apple units. The total utility Curve will be increasing in the beginning and later falls. The Marginal Utility curve is falling from left down to the right clearly tells us that the satisfaction derived from the successive consumption of apples is falling.

The Marginal Utility of the first apple is known as initial utility. It is 30 utils. The Marginal utility of the seventh apple is Zero. Therefore, this point is called the satiety point. The Marginal Utility of the eighth apple is -2. So, it is called Negative utility and lies below the X axis.

Consumer Behaviour:
Every consumer has clear-cut preferences over the products that are available. The consumer always behaves rationally and tries to make use of his money income to get maximum satisfaction. With his limited income, he decides to consume more of one product and less of another.

2nd PUC Economics Notes Chapter 2 Theory of Consumer Behaviour

Budget set and Budget Line:

Budget Set: (A budget set is a collection of all the bundles that the consumer can buy this income prevailing market prices. The Budget set is also known as opportunity set. It provides all the goods (all possible combinations of quantities of two goods) which the consmer can purchase given level of income)

Budget line: Budget line is a graphical representation of all possible combinations two goods when can be purchased with a given income and prices, such that the total cost of these combinations is equal to the income of the consumer. It is a locus of different combinations of two goods which the consumer purchases and whose cost equals his income)

The concepts of Budget Set and Budget Line can be explained with an illustration. Suppose a consumer has Rs.40. He spends this on two commodities Mango and Banana. The possible of spending Rs.40 are given in a form of table as follows. Let us assume that the price of Mango is Rs.8 each and Banana is Rs.4 each.
2nd PUC Economics Notes Chapter 2 Theory of Consumer Behaviour 2
2nd PUC Economics Notes Chapter 2 Theory of Consumer Behaviour 3
In the above diagram, Mangoes are measured along X-axis, and Bananas are measured along axis. At Point A, the consumer is spending his entire income on Mangoes and at Point F he buys only bananas. Between A and F, there are other options like B, C, D, E. By joining these points, we get, a straight line AF which represents the consumer’s possible purchasing options in spending his entire income of Rs.40, on these two goods at the given prices.

2nd PUC Economics Notes Chapter 2 Theory of Consumer Behaviour

Features or properties of Budget Line:

1. The Budget line AF slopes downwards from left to right indicating that more of one product can be purchased by reducing some units of the other product.

2. The combination of products which are equal to consumer’s income lie on the Budget line.

3. The combinations whose total price is less than consumer’s income, lie below the Budget A line. They show under-spending.

4. The combination of goods whose totafprice is more, lie above the Budget line. These options
are not affordable prices to the consumer.

Slope of the Budget Line: The slope of a curve is calculated as a change in the variable on the Vertical or Y axis divided by change in the variable on’the horizontal or X axis.
2nd PUC Economics Notes Chapter 2 Theory of Consumer Behaviour 4

Price Ratio: It refers to the price of the good on the X axis divided by the prjce of the good on the Y axis.

Shift in Budget Line: A shift in Budget line takes place if there is a change in the income of ‘ the consumer or price of the products.

(a) Effect of a change in the income of the consumer: With a change in income of the consumer, the Budget line shifts to the right or to the left of the original budget line.

Suppose there is an increase in the income of the consumer, the budget line shifts to the right of the original budget line. This is represented in the following diagram:
2nd PUC Economics Notes Chapter 2 Theory of Consumer Behaviour 6
If there is decrease in the income of the consumer, the budget line shifts to the left of the original budget as shown in the diagram below:

Effect of change in the relative prices: If there is any change in the prices of the two products, by keeping money income constant, the budget line will change. There will be a change in the slope of the budget line.

2nd PUC Economics Notes Chapter 2 Theory of Consumer Behaviour

If the price of Mango falls, the budget line will shift to the right of the original budget line making, a narrower angle with the x-axis. From BA it becomes BA1.
2nd PUC Economics Notes Chapter 2 Theory of Consumer Behaviour 8
If the price of Banana increases, the budget line will shift to the left of the original budget line making, a wider angle with the y-axis. From BA it becomes B1A.
2nd PUC Economics Notes Chapter 2 Theory of Consumer Behaviour 9

Concept of Indifference Curve Analysis:

An Indifference Curve is the locus of all those points representing various combinations of two goods giving the same satisfaction to the Consumer.

According A.L.Meyers, “An Indifference curve is a schedule of various combinations 01 goods which will be equally satisfactory to the consumer concerned.”

Indifference Schedule:
An Indifference Schedule is a table representing the various combinations of goods which give equal satisfaction to the consumer. The following table shows the indifference schedule of combinations of Biscuits and cups of Tea for a consumer
2nd PUC Economics Notes Chapter 2 Theory of Consumer Behaviour 10
In the above table, it is assumed that consumer is purchasing combination of cups of lea and biscuits. He is indifferent between the five combinations given above Combination A show s that the consumer has one eup of tea and 12 biscuits, while combination B show s that the Consumer gets two cups of tea and 08 biscuits. The consumer is indifferent between these combinations since they give him the same level ofSatisfaction. Similar is the case with the other combinations i.e. C D E and F.

2nd PUC Economics Notes Chapter 2 Theory of Consumer Behaviour

Indifference curve:

2nd PUC Economics Notes Chapter 2 Theory of Consumer Behaviour 12

In the above diagram. IC is an Indifference curve. The different points on it show the various combinations of Tea and Biscuits. The consumer likes all of them equally. IIc is indifferent about is shoen by joining these points we obtain the IC. Although in the successive combinations the amount of biscuits goes on diminishing as we move from the left side of the IC to the right, the increase in the quantity of tea is sufficient to compensate him for the loss of biscuits so that the consumer is indifferent about them, indifference, curve shows the different combinations of two commodities in which consumers get equal satisfaction.

Indifference Map: It refers to a set of indifference curves for two commodities showing different levels of satisfaction. The higher indifference curves show higher level of satisfaction and lower IC ‘ represent lower satisfaction. A rational consumer always chooses more of that product that offers him a higher satisfaction and represent in higher IC. It is also called ‘Monotonic preferences’.
2nd PUC Economics Notes Chapter 2 Theory of Consumer Behaviour 13

Marginal Rate of Substitution (MRS):

→ It means that as the amount of a commodity with the consumer goes on increasing he is prepared to exchange the other commodity for equal units of the commodity whose amount is increasing.

→ A study of the IC shows that as the consumer gets one more unit of the commodity on the horizontal axis, his total satisfaction is increased. If he wants to maintain his satisfaction at the same level, he has to sacrifice some units of the commodity on the vertical axis. If by obtaining one unit of a commodity A, he is prepared to give up five units of the Commodity B and maintain his satisfaction’ at the same level, then five units of commodity B is the Marginal Rate of substitution for one unit of the commodity A.

→ According to Prof.Bilas, “The marginal rate of substitution of X for Y is defined as the amount of Y the consumer is just willing to give up to get one more unit of X and maintain the same level of satisfaction.

→ The marginal rate of substitution between two commodities is shown by the shape of indifference curve showing their combinations. If the two commodities are X and Y, the MRS between them is written as MRSxy = ∆X/∆Y. It is the rate at which the consumer is willing to substitute Y for X.

The main feature of MRS is that it diminishes as one commodity is increased and the other commodity is decreased in the consumer’s indifference schedule. As a result the indifference curve slopes from left to the right. It means a negative and diminishing rate of substitution of one commodity for the other.

2nd PUC Economics Notes Chapter 2 Theory of Consumer Behaviour

DMRS-Diminishing Marginal Rate of Substitution:

It was built by Prof.J.R.Hicks. This principle is similar to the Law of diminishing marginal utility and is yetdifferent. The DMRS states that the consumer will be willing to forgo smaller and smaller units of Y in order to have successive additional units of X. This can be explained with the help of following table.
2nd PUC Economics Notes Chapter 2 Theory of Consumer Behaviour 14

In the above table, all the combinations give the same satisfaction to the consumer. If he chooses combination A he gets one cup of tea and 12 biscuits. In the combination B, he gets one more cup of tea and is prepared to give up four biscuits for it. The MRS here is 1:4. In the combination C, he is willing to sacrifice only three biscuits for another cup of tea. The MRS falls to become 1:3. In the successive combinations D and E MRS continues to fall. This illustrates the diminishing marginal rate of substitution.

MRS of X fork Yjs the ratio of the change in the-quantity of Y for a change in the marginal quantity of X which would keep the consumer on the same indifference curve.
MRSxy = AX/AY.

Since MRS is denoted as. the slope of an indifference curve, it is conunonly negative and falling. The convex IC falling from left down to the right shows the Law of Diminishing Marginal Rate of Substitution.
2nd PUC Economics Notes Chapter 2 Theory of Consumer Behaviour 15
In the above diagram the MRS is diminishing from the points A to B, C, D and so on.

2nd PUC Economics Notes Chapter 2 Theory of Consumer Behaviour

Properties of Indifference Curves.

1. Higher Indifference Curves represent higher levels of satisfaction:
In the diagram, the indifference curve IC2 lies above and to the right of the Indifference curve IC1 Since IC2 is the higher indifference Curve, it shows higher satisfaction. Like wise IC3 lies above IC2.
2nd PUC Economics Notes Chapter 2 Theory of Consumer Behaviour 16

2. ICs must slope from left downward to the right:
Indifference curves must slope down from left to the right, ie., they must have a negative slope. Our assumption that the consumer would like to have more of both goods helps in proving this. As we move from left to the right on an IC, it means more of the commodity represented on the X axis. With every increase in the amount of one commodity, the consumer becomes-better off.
2nd PUC Economics Notes Chapter 2 Theory of Consumer Behaviour 17

3. Indifference curves do not intersect: The indifference curves can never meet on intersect so that only one indifference curve can pass through any one point in the indifference map. In other words, one combination of goods can lie only on one IC In the diagram given below two indifference curves IC and IC intersect each other at B. Since points C and same indifference curve IC. the consumeras indifference between them. But both are given him different levels of satisfactionWinch is not possible if he is in same indifferencences.
2nd PUC Economics Notes Chapter 2 Theory of Consumer Behaviour 18
If the two IGs intersect, the same IC show different level of satisfaction. In the above diagram ‘A’ and ‘B’ are representing two levels of satisfaction which is absurd, similarly incase of IC2 also.

2nd PUC Economics Notes Chapter 2 Theory of Consumer Behaviour

4. Indifference Curves are convex to the origin: The MRS between two goods diminishes as we-move from left down to the right along the IC as shown below. Points P and Q lie on indifference curve IC. As we move from P to Q, there is an increase of commodity A but a corresponding lessening of commodity B. That means MRS goes on diminishing along the IC. So IC should be convex to the origin.
2nd PUC Economics Notes Chapter 2 Theory of Consumer Behaviour 19

5. The IC cannot be a vertical or a horizontal line: If IC is vertical or horizontal, it means that the consumer consumes by changing only one commodity without altering the consumption of other commodity. This cannot be true as the consumer is changing consumption of both the commodities to get maximum satisfaction.

If it is vertical, product x remains the same and if it is horizontal, product y remains the same. But this cannot lead to substitution.
2nd PUC Economics Notes Chapter 2 Theory of Consumer Behaviour 20

6. IC cannot be a downward sloping straight line: A straight line IC shows perfect substitutes on the X and Y axis; therefore, the MRS remains the same in spite of the fact that the stock of one good continues to . increase and that of the other diminishes.
2nd PUC Economics Notes Chapter 2 Theory of Consumer Behaviour 21

2nd PUC Economics Notes Chapter 2 Theory of Consumer Behaviour

7. An IC cannot be concave to the origin: An IC cannot be concave. If it is concave, it shows increasing marginal rate of substitution which is not possible in case of IC analysis.
2nd PUC Economics Notes Chapter 2 Theory of Consumer Behaviour 22

8. IC cannot be positively sloped: If IC slopes upwards Y -positively, it means that the consumer prefers more N units of both the commodities, which is not possible, is
2nd PUC Economics Notes Chapter 2 Theory of Consumer Behaviour 23

9. Indifference curves can ndt be parallele: If the IC, are parallel, the marginal rate of substitution diminishes at the same rate. But, this is not true.
2nd PUC Economics Notes Chapter 2 Theory of Consumer Behaviour 24

2nd PUC Economics Notes Chapter 2 Theory of Consumer Behaviour

10. The ICs do not touch the horizontal or the Vertical axes: Indifference curves have the basic assumption that the consumer purchases combinations of different commodities. Therefore, he is not supposed to purchase only one commodity because in that case the IC will touch one axis. Purchasing only one commodity means monomania i.e., consumer’s lack of interest in the other commodity.
2nd PUC Economics Notes Chapter 2 Theory of Consumer Behaviour 25

11. An IC cannot have a bulge: The bulge in IC shows that the Marginal rate of substitution is not diminishing consistently. Here the consumer is irrational and behaving erratically.
2nd PUC Economics Notes Chapter 2 Theory of Consumer Behaviour 26

Optimal Choice of Consumer (CONSUMER’S EQUILIBRIUM).

A consumer tries to achieve maximum satisfaction with his limited Budget. Now to know his equilibrium i.e., maximum satisfaction, we have to combine IC with the Budget line.

That means when the Budget line of a consumer is tangent to his IC, he is in equilibrium.

Assumptions:

  • Income of consumer remains constant,
  • Consumer behaves rationally.
  • Prices of goods rfemain constant.
  • All goods are homogeneous.
  • All goods are divisible.
  • The condition of transitivity is satisfied i.e., if A > B, B > C then A > C.

2nd PUC Economics Notes Chapter 2 Theory of Consumer Behaviour 27

2nd PUC Economics Notes Chapter 2 Theory of Consumer Behaviour

PQ is the budget line.
The consumer has attained his optimal choice at point E where he buys OM quantity of x product and ON quantity of y product within his budget to get maximum satisfaction. If he selects a point below E, he is wasting his available income and the combinations above this point are not possible as his income is not sufficient. At Point E, the Budget line and IC2 intersect. This can be expressed as follows:
2nd PUC Economics Notes Chapter 2 Theory of Consumer Behaviour 28
That means the willingness to substitute is equivalent to the ability to pay. So, a consumer is said to be in equilibrium if his budget line is tangent to IC or when the MRS is equal to the price ratio of the two goods.

2nd PUC Economics Notes

2nd PUC Economics Notes Chapter 1 Introduction to Micro Economics

Karnataka 2nd PUC Economics Notes Chapter 1 Introduction to Micro Economics

An economic system or economy is a mechanism where the sources are channelized on priority to produce goods and services. These goods and services produced by all the sectors of the economy, determine the national income.

1. What to produce: Every country has to decide which goods are to be produced and in what quantities. Whether more guns should be produced or more foodgrains should be grown or whether more capital goods like machines, tools, etc., should be produced or more consumer goods (electrical goods, daily usable products etc.) will be produced.

2. How to produce: There are various alternative techniques of producing a product. For example, cotton cloth can be produced with either handloom or power looms. Production of cloth with handloom requires more labour and production with power loom .needs use of more machines and capital. It involves selection of technology to produce goods and services.
There are two types of techniques of production viz.,
(a) Labour intensive technology and
(b) Capital intensive technology.

3. For whom to produce: Another important decision which an economy has to take is for whom to produce. Economy cannot satisfy the wants of all the people^ Therefore, it has to decide who should get how much of the total output of goods and services.
Apart from the above, an economy also faces other problems: They are as follows:

(a) The problem of economic efficiency: The efficient utilisation of existing resources of an economy has also become a major problem. The optimum use of both natural and human resources is needed to prevent-the wastage of these resources.

(b) The problem of full employment: Full employment means utilisation of resources to the fullest extent. Under utilisation of human resources leads to unemployment, disguised unemployment etc. If the natural resources are not used to the maximum, there is a wastage of potentiality of an economy.

(c) The problem of economic growth: Every nation wants to increase its Gross Domestic Product to achieve economic growth. This in turn improves standard of living and reduces poverty. A higher standard of living will put more demand on the products available.

2nd PUC Economics Notes Chapter 1 Introduction to Micro Economics

Organisation of Economic Activities:

The main types of economic system are:
(a) Socialistic/Centrally planned Economy,
(b) Capitalistic/Market Economy and
(c) Mixed Economy.

(a) Centrally planned Economy or Socialistic Economy: A centrally planned economy also called as socialistic economy is that economy where the economic activities are controlled by the central Government. Here, the Government takes decisions about the allocation of resources in accordance with objectives to attain economic and social welfare. Example, Russia, China, North Korea etc.

(b) Market Economy or Capitalistic Economy: A Market economy also known as Capitalistic economy is that economy in which the economic decisions are undertaken on the basis of market mechanism by the private entrepreneurs. It functions on demand and supply conditions. Example: USA

(c) Mixed Economy: A mixed economy is that economy in which we can see co-existence of both private and public sector enterprises. It is the combination of Socialistic and Capitalistic features.
The best example is India.

2nd PUC Economics Notes Chapter 1 Introduction to Micro Economics

Positive and Normative Economics:

Positive Economics:
→ Positive economics is the study of what was’ and ‘what is’ under the given set of circumstances. It is concerned with how the economy performs, the basic functions of what to produce, how to produce and. for whom to produce. It explains how the economy takes decisions about consumption, production and exchange of goods.

→ It deals with the scientific explanation of the working of the economy. It analyses every issue of economics from a positive perspective without passing any value judgments. It deals with the cause and effect relationship of economic variables.

Normative Economics:
→ Normative economics studies ‘what ought to be’. It explains about ‘what should be and should not be done’. Here we try to understand that whether the mechanisms are desirable or not. The normative economic statements are sometime called matters of opinion or statements of value.

→ Economists who advise Governments are normally concerned about normative economics. In India, Economic advisers who are appointed by the Government are responsible for advising the Prime Minister as to which of the policies are good and beneficial to the country’s economy and which are bad and detrimental on the whole.

2nd PUC Economics Notes Chapter 1 Introduction to Micro Economics

Economics is both Positive and Normative:

But, Economics is both positive and normative science. The study of economics involves both scientific investigation and policy analysis. Economists first use science to explain the world and understand how the economy wonts, later policies are explored for the economic development.

Deductive and Inductive Methods of Economics

Deductive Method:
Under this method, the conclusions are drawn based on inferences from the universal to the individual or from general to the particular. This method derives new conclusions from fundamental assumptions. It is also called as ‘Scientific Method’. It is of four stages viz.,

  • Identification of the hypothesis to be tested.
  • Generations of predictions from the hypothesis.
  • Conducting experiments to check whether the predictions are correct.
  • Confirming the hypothesis.

Inductive Method:
→ This is also called as empirical method. This method was advocated by Frederic List, Rosher and Hilde Brand. Inductive

→ Method is a process of reasoning from a particular to general or from individual to the universal. It functions in four stages viz.,

  • Selection of an economic problem and defining the same clearly.
  • Collection of data using statistical techniques.
  • Analysing the data.
  • Observation and generalization to establish a general truth.

2nd PUC Economics Notes Chapter 1 Introduction to Micro Economics

Micro Economics:

Micro economics is the study of the economic actions of individuals and small groups of individuals. According to Boulding, “the study of particular firm, particular household, individual price, wages, income, individual industry, particular commodity, is micro economics.”

Micro economics is an important method of economic analysis. It has both theoretical and practical importance.

  • Helpful in the efficient deployment of resources-allocation of resources.
  • Helps in understanding the working of the economy.
  • Provide tools for formulating economic policies.
  • Useful in understanding the problems of Taxation.
  • Helpful in International Trade.
  • Helps us to know the Market structure.
  • Construction and use of economic models to understand the economic phenomenon, (viii) The basis of predictions.
  • Solution to the problem of choice.
  • Help to business executives.
  • Helps in formulation of economic planning.
  • Expands intellectual capacity of Human mind.

2nd PUC Economics Notes

2nd PUC Economics Notes Karnataka

Karnataka 2nd PUC Economics Notes

2nd PUC Economics Notes Part A – Micro Economics

2nd PUC Economics Notes Part B – Macro Economics

2nd PUC Biology Notes Chapter 16 Environmental Issues

Karnataka 2nd PUC Biology Notes Chapter 16 Environmental Issues

Pollution

Pollution and the Important Types of Pollutants

→ As Odum defines, pollution is the undesirable change in physical, chemical and biological characteristics of our environment, adversely affecting human health and life of domestic animals.

→ Pollution is also defined as the unfavourable alteration or contamination of our environment, largely as a result of human activities.

2nd PUC Biology Notes Chapter 15 Biodiversity and Conservation

→ The pollution causing factors are called pollutants. Some of the important types of pollutants are described as follows:

  • Bio degradable pollutant
  • Non-bio degradable pollutant
  • Primary pollutant
  • Secondary pollutant and
  • Biological pollutant.

Bio degradable pollutants: Bio degradable pollutants are those that undergo natural process of bacterial decomposition and are reduced to less stable, less toxic and less harmful substances. They,pose pollution problems only when the rate of their accumulation (dumping) exceeds the rate of decomposition, e.g. Cowdung, Sewage and organic wastes including dead bodies of plants and animals.

Non-bio degradable pollutants: Non-bio degradable pollutants are those that undergo little or no degradation and hence they are more stable, more toxic and more harmful pollutants. They pass through food chains and reach the body tissues of top consumers including man where they gradually build up to toxic level. This process is called biological magnification, e.g. Plastics, metallic dust like mercury salts at high concentration, lead, cadmium and pesticides like D.D.T., concrete, glass etc.

Primary pollutants: Primary pollutants are those that are causing pollution of the environment, as soon as they are released from their sources, like automobiles and industries, e.g. Carbon monoxide, sulphur dioxide, oxides of nitrogen, hydrocarbons, lead, smoke, soot and dust etc.

Secondary pollutants : They are formed by the combination of two or more primary pollutants. For example,
a. Sulphur dioxide combines with the atmospheric moisture to form sulphuric acid as secondary pollutant responsible for acid rains.

b. Oxides of nitrogen combine with hydrocarbons in the presence of UV rays of sunlight to
form secondary pollutants, e.g: Ozone and Peroxy acetyl nitrate (PAN). They in turn combine with atmospheric fog and dust to form a poisonous cloud called Photochemical smog.

Biological pollutants: Biological pollutants are those that have a biological origin. They include viruses, bacteria, dust mites, pollen dust and fungal spores.

Air Pollution:

It is undesirable change in physical, chemical and biological characteristics of air adversely affecting human health and life of domestic animals. It is the increase of all other gases in the atmosphere except oxygen.

Types of air pollutant and sources:
→ Carbon monoxide, sulphur dioxide, oxides of nitrogen, hydrocarbons and lead are released from the incomplete combustion of oil, coal and wood during domestic and industrial burnings, automobile exhausts and other transporters like marine vessels, railways and air crafts.

→ Benzopurines released from tobacco smoke, automobile exhaust and industrial processes.

→ Chloro fluro carbons (CFC) released from the manufacturing unit of refrigerators, airconditioners and aerosol sprays.

→ Smoke and soot released from the chimneys of industries and from forest fires.

→ Dust dump into air during dust starps and volcanic eruptions.

→ Ionising radiations like a, b and g-rays released from atomic explosions and nuclear reactors.

→ Biological pollutants like dust mites, virus, bacteria, fungal spores and pollen dust.

→ Foul smelling gases like hydrogen sulphide released from the decomposing dead bodies of plants and animals.

→ Radioactive fall outs and emissions from thermal power projects.

2nd PUC Biology Notes Chapter 15 Biodiversity and Conservation

Effects or hazards of air pollutants:
→ CO – To main air pollutant and 2/3rd of polluting air comes from automobile exhausts. CO combines with haemoglobin of RBC to form toxic stable compound called carboxy haemoglobin. This considerably reduces oxygen carrying capacity of blood causes suffocation and giddiness. In higher concentration, CO causes unconsciousness and even death.

→ SO2 – Causes headache, nausea, bronchitis and asthma. Sulphur dioxide combines with atmospheric moisture to form H2SO4 responsible for acid rains. Acid rains cause radical pH changes in soil and water, which is injuries to both plant life and animal life.

→ NO2 – Causes pulmonary discomforts , irritation of eyes and nose. They combine with hydrocarbons to form ozone and PAN (Peroxy Acetyl Nitrate), which contribute to poisonous cloud formation called photochemical smog. Ozone and PAN – cause damage to the mucus membrane of respiratory system, genetic material (DNA) and destroy chloroplast. They are proved to be injuries to leafy vegetable crop plants and fruit gardens. PAN is a proven carcinogenic.

→ CFC – They reach higher altitudes of atmosphere causing peeling of the protective ozone umbrella. This allows UV – rays of sunlight to reach the earth’s surface responsible for increasing incidence of skin cancer.

→ Green house effect – Automobile and industrial activities coupled with deforestation, tend to increase carbon dioxide levels in air which, prevents escape of heat radiation from earth surfaces , resulting in global warming. This phenomenon is called green house effect. If unchecked, it is likely to raise the sea level by atleast by 60 feet, submerging coastal areas and low lying areas allover the world.

→ Radioactive ionization – causes harmful mutations in living organisms resulting in deformities in the newly born the young. Fungal spores, pollen dust and dust mites are major causes of skin and respiratory allergies.

Preventive measures:

→ Factories and industries should be situated away from residential areas to avoid pollution of cities and towns.

→ Use of electrostatic precipitators to filter out particles or matter from industrial emissions.

→ Industrial chimney lenght should be advised release smoke and soot into higher altitudes.

→ Discouraging the use of smoke producing fuel like wood, coal and oil in industrial and domestic burning, encouraging the use of smokeless fuel like cooking gas and electrical appliances.

→ Use of exhaust filters to automobiles to minimize emission of exhaust fumes.

→ Encouraging the growth of forest undertaking large-scale plantation and maintaining gardens would help to reduce air pollution.
2nd PUC Biology Notes Chapter 16 Environmental Issues Pollution 1

2nd PUC Biology Notes Chapter 15 Biodiversity and Conservation

Electrostatic Precipitator:

→ It is the most widely used method for removal of particulate matters about 99% of particulate pollutants are removed from the exhaust of thermal power plants by this method.

→ It has electrode wires and a stage of collecting plates.

→ The electrode wires are maintained at several thousand volts, which produce a corona that releases electrons.

→ These electrons get attached to the (dust) particles and give them a net negative charge within a very small fraction of a second.
The collecting plates are grounded and hence attract the charged particles.

→ The velocity of air between the plates must be low enough to allow the particles to fall on to them .

Scrubber:

→ A scrubber is used to remove gases like sulphur dioxide from industrial exhaust.

→ The exhaust is passed through a spray of water or lime.

→ Water dissolves the gases and lime reacts with sulphur dioxide to form a precipitate of calcium sulphate or sulphite.

Catalytic Converters:

→ These are used in automobiles for reducing emission of harmful gases.

→ They have expensive metals like platinum, palladium and rhodium as catalysts.

→ As the exhaust passes through the catalytic converter, unbumt hydrocarbons are converted into carbon dioxide and water. Carbon monoxide and nitric oxide are changed into carbon dioxide and nitrogen gas respectively.

→ Vehicles fitted with catalytic converters should use unleaded petrol as lead in the petrol inactivates the catalyst.

Controlling Vehicular Air Pollution: A case study of Delhi:

→ In the 1990s, Delhi ranked fourth among the 41 most polluted cities of the world. Air pollution problems in Delhi became serious. Reducing vehicular pollution included phasing out of old vehicles, use of unleaded petrol, use of low-sulphur petrol arid diesel, use of catalytic converters in vehicles, application of stringent pollution level norms for vehicles, etc.

→ The Bharat Stage II (equivalent to Euro – II norms), which is currently in place in Delhi, Mumbai, Kolkata, Chennai, Bangalore, Hyderabad, Ahmedabad, Pune, Surat, Kanpur and Agra, will be applicable to all automobiles throughout the country from 1 April 2005. All automobiles and fuel-petrol and diesel – were to have met the Euro III emission specifications in these 11 cities from 1 April 2005 and have to meet the Euro-IV norms by 1 April 2010. The rest of the country will have Euro – III emission norm compliant automobiles and fuels by 2010.

Noise :
→ Noise is the undesired high level of sound. Noise causes psychological and physiological disorders in humans. A brief exposure to extremely high sound level, 150 dB or more generated by take off of a jet plane or rocket, may damage ear drums. Chronic exposure to a relatively high noise level of cities may permanently damage hearing abilities of humans. Noise also causes sleeplessness, increased heart beat, altered breathing pattern, thus considerably stressing humans.

→ Considering the many dangerous effects of noise pollution the unnecessary sources of noise pollution should be reduced immediately. Stringent following of laws laid down in relation to noise like delimitation of horn-free zones around hospitals and schools, permissible sound-levels of crackers and of loud speakers, timings after which louds speakers cannot be played, etc.

2nd PUC Biology Notes Chapter 15 Biodiversity and Conservation

Water Pollution

It is the undesirable change in physical, chemical and biological characteristics of water resources adversly affecting human health and life of domestic animals.
The four main types of water pollution are

  • Sewage pollution.
  • Industrial pollution.
  • Biocide pollution.
  • Thermal pollution.

Sewage Pollution:
Sewage is a biodegradable pollutant concentrated with human faces, animal excreta, food residues, domestic wastes, detergents and several dissolved chemicals (sulphates, phosphates, alkalies, nitrates, acids). Sewage also contains pathogenic bacteria, eggs, cysts and spores of parasites. Sewage is discarded from homes, hotels, and choultries and hostels being dumped constantly into near by water resources like lakes, ponds, rivers and oceans causing water pollution.

Effects:
→ Presence of sewage increases turbidity of water, which reduces solubility of oxygen and penetration of light, both of which adversely affect the photosynthetic and respiratory activities of aquatic organisms.

→Sewage water provides good breeding ground for mosquitoes and favours growth of pathogenic bacteria and parasites. Thus it forms a source for the out break of diseases like malaria, typhoid, cholera, jaundice and dysentery.

→ Sewage dumping causes sudden nutrient enrichment resulting in plankton bloom. This process is called eutrophication. It creates biological oxygen demand (BOD), and oxygen shortage to fishes, which suffocate to death.

→ To prevent these effects, sewage treatment should be done before letting it out.

Note: Bio-magnification:
→ It is the process of accumulation of certain pollutants in tissues, with increased concentration, along the food chain. Most of the pesticides are non degradable and are persistent and get accumulated in increasing concentration e.g. DDT is insoluble in water and is non-biodegradable. When it is extensively used, it goes into the soil through the rainwater.

→ From the soil, DDT passes into plants, in which DDT is found to be more concentrated than in soil. Experiments have revealed that in a food chain, DDT becomes more and more concentrated and accumulated when it passes from the lower to the higher trophic levels. The accumulation and concentration of DDT in each trophic level, on an average, increases by ten times.

Industrial Effluent Pollution:
They are byproducts disposed from industries and dumped into the nearby water resources causing water pollution. Effluents includes acids, alkalies, metallic dust like mercury, lead, copper, cadmium and zinc, phenol and cyanides and oil spills the sources include factories, industries, mills, oil refineries, thermal power plants, fertilizers and detergent industries.

2nd PUC Biology Notes Chapter 15 Biodiversity and Conservation

Effects:
→ They cause radical change in pH of water, which adversely affects growth, and survival of aquatic life.

→ They decrease oxygen solubility in water and thus affect respiratory activity of aquatic organism.

→ Most effluents are non biodegradable pollutants. Hence they pass through food chain and reach the body tissues of humans where they undergo biological magnification building up to toxic level. Mercury causes haemolysis, lead causes anaemia and cancer of brain and lungs, copper causes hypertension , cadmium causes bone damage and Zinc causes renal damage.

Control measures :

  • Treatment of effluents to eliminate the toxic constituents.
  • Enforcement of strict and appropriate laws to minimise release of effluents into the water resources.

Biocide Pollution of Water:
Include D.D.T, aldrin and endrin etc. that are used in agricultural fields and fruit gardens to get rid of animals and pests on plants. From fields along with run off water, they reach ponds, lakes, rivers and sea, polluting water.

Effects of D.D.T (Biocide)
→ D.D.T and other biocides are non-biodegradable pollutants. Hence they pass through food Chains finally reaching the tissues of man where they undergo biologica\ magnification. D.D.T causes neurological disorders, genetic damage and sterility and harmful mutations. Under its influence the new born may show deformities.

→ Accumulation of D.D.T in birds results in laying of weak shelled eggs, which increases the mortality of chicks.

→ D.D.T causes bleaching of leaves by destroying chloroplast an effect called as chlorosis. This causes damage to vegetation.

Control of Biocide pollution:

  • Discouraging the use of D.D.T.
  • Only selective pesticides in just the required quantities should be used.
  • Encouraging eradication of pests by methods of biological control
  • Pesticides should be used with care under the supervision of specialist.
  • Persons handling pesticides should use masks and gloves.
  • Food and edible items should be properly covered before spraying pesticides in houses.

Thermal Pollution:

  • Thermal power stations, many industries and nuclear reactors use large quantities of water.
  • The effluents as well as the residual hot water, is dumped into the nearby water resources causing thermal pollution.

Effects
Hot water decreases the oxygen solubility and alters respiratory activity of aquatic organisms and warmer water favors entry of toxic substances into bodies of aquatic ‘ organisms.

Control measures:
The concerned industries should have provision to store the residual hot water, cool it before it is discarded.

2nd PUC Biology Notes Chapter 15 Biodiversity and Conservation

Soil Pollution:

It refers to the undesirable change in physical, chemical and biological soil adversely affecting its fertility and the activities of its living organisms. Soil pollutants include metal scraps, discarded organic wastes, papers, glass pieces, discarded herbicides, fungicides and pesticides, plastics and other chemical wastes discarded from industries.
In total, it is the loss of vigour and vitality that supports life of plants and microbes.

Effects:
→ The pollutants cause high alkalinity or acidity of soil both of which are injurious to life forms.

→ The eggs & cysts of parasites like Ascaris and hook worms are transmitted through soil to man by contamination.

Control measures:
→ Indiscriminate dumping of garbage wastes to be avoided.

→ The solid wastes like plastics metal scraps and papers, cloth rag should be separated from soil and are recycled.

Solid Wastes:
Solid wastes refer to everything that goes out in trash.
They are of the following types :
(a) Municipal solid wastes:
These are wastes from homes, offices, schools, etc. that are collected and disposed by the municipality and generally consist of paper, waste food materials, leather, textile, rubber, glass, etc. When they are dumped in the open, they provide a breeding ground for flies and other insects, which may be vectors.

(b) Fly ash:
Thermal power plants generate fly ash, which is composed of oxides of Silica, iron and aluminium and low concentrations of toxic heavy metals.

(c) Defunct ships:
Defunct ships are broken down in developing countries for scrap metal. They contain toxic „ substances like asbestos, polychlorinated biphenyls, tributylin, lead, mercury, etc.
The workers are not suitably protected and are exposed to toxic chemicals.
The coastal area in the vicinity of the ship breaking yard becomes polluted.

2nd PUC Biology Notes Chapter 15 Biodiversity and Conservation

Hospital wastes:
→ Hospitals produce and dump many hazarduous wastes that contain pathogenic microbes, disinfectants and other harmful chemicals.

→ The use of incinerators is crucial for the disposal of hospital wastes.

Industrial wastes:
→ Industries involved in manufacture of paper, rubber, pesticides, dye, etc. produce large amounts of corrosive and highly inflammable chemicals.

Electronic wastes (e-wastes):
→ e-wastes are generated in the developed countries and are sent to developing countries where certain metals like gold, nickel, silicon, copper, iron, etc. are recovered from them.

→ Then recycling is done manually and hence, the workers are exposed to the toxic substances.

Disposal of solid wastes:

  • Municipal solid wastes are burnt to reduce their volume. But, they are not burnt completely and the open dumps serve as breeding grounds for flies and rats.
  • Sanitary landfills have been adopted as an alternative to open-burning dumps.
  • Municipal wastes are incinerated and the heat emitted is used to generate electricity.
  • They are also recycled for various components.
  • Fly ash is used in construction industry or buried as landfill. It is also used for soil augmentation as it increases water retention and aeration of soil.
  • e-wastes are buried as landfills or incinerated. They are also recycled.

Agro – Chemicals and their effects:
In the wake of green revolution, use of inorganic fertilisers and pesticides has increased manifold for enhancing crop production. Pesticides, herbicides, fungicides, etc., are being increasingly used. These incidentally, are also toxic to non-target organisms, that are important components of the soil ecosystem.

Radioactive wastes:
→ Radiation, which is given off by nuclear waste is extremely damaging to organisms, because it causes mutations at a very high rate. At high doses nuclear radiation is lethal but at lower doses, it creates various disorders, the most frequent of all being cancer. Therefore, nuclear waste is an extremely potent pollutant and has to be dealt with utmost caution.

→ It has been recommended that storage of nuclear waste, after sufficient pre-treatment, should. be done in suitable shielded containers, buried within the rocks, about 500 m cleep below the earth’s surface.

Global Issues:

Because of the increase in human population and rising human aspirations, a number of transformations are going on in the biosphere They include land use changes, disturbed life support system, industrial development, increased energy production from fossil fuels and urbanization.

Global Warming and Green House Effect:

Green house gases:
They are gaseous components of atmosphere which allow the short wave radiations to pass through but absorb the long wave heat (infra-red) radiations. Presence of green house gases (CO2, CH4, N2O, CFCs) in the atmosphere, convert it into a window glass pane like cover around the earth (as found in a glass houses). It allows most of the solar radiations which have shorter wave length (0-2 – 4-0nm) to reach up to earth’s surface. As the solar radiations are reflected from earth’s surface they are changed into long wave radiations.

A part of this energy is re-radiated back to the surface of earth. The downward flux of long wave radiation by green house gases is called green house flux. It is important in keeping the earth warm with an average or mean annual temperature of about 15° C. In the absence of this flux, the earth’s mean temperature would drop to 20°C at which temperature water will freeze and kill most life forms.

2nd PUC Biology Notes Chapter 15 Biodiversity and Conservation

Effect of global warming:
Global warming, a consequence of higher concentration of green house gases, has the potential to affect weather and climate, stratosphere and thermosphere, rise in sea level, species distribution and food production.

1. Weather and climate: Global mean temperature rose by 0-6° C during the 20th century. It is going to increase further by 1-4° – 5-8°C between 1990 – 2100 AD.

2. Stratosphere and thermosphere: Warming of troposphere will cause cooling of stratosphere and thermosphere. The whole atmosphere will shrink. Cooling of stratosphere will increase the size of ozone holes and thinning of ozone shield at other places. Cooling of thermosphere will disrupt communications and the shielding effect of ionosphere.

3. Sea level change: It is believed that sea level has risen by 15cm during the 20th century, a rise of 1 -2 mm every year. By the year 2100 AD, the global mean sea level is going to rise by 0-88m over that of 1990 sea level. Rise in sea level is due to thermal expansion of oceans as the temperature rises, melting of glaciers and Greenland ice sheets.

4. Range of species distribution : Each species has a particular range of temperature. Global warming will push tropics into temperate areas and temperate areas towards poles and higher altitudes in mountains Arise of 2°-5° C can cause pushing of temperate, range vegetation some 250-600km towards the pole.

5. Food production : Rise in global temperature is going to have a negative impact on food production despite beneficial effect of CO2 fertilization. The various reasons are increase in basal rate of respiration by plants.

  • Lesser storge of food and hence less productivity.
  • Explosive growth of weeds.
  • Higher incidence of pathogens and pests.
  • Increased evaporation of soil water and higher transpiration from plants resulting in water deficiency.

Approaches to deal with global warming:
→ Limiting the use of fossil fuels so as to reduce emission of green house gases.

→ Early use of hydrogen fuel.

→ Increasing use of alternative, renewable, nonpolluting sources of energy like solar energy, wind energy, hydropower, etc.

→ Increasing vegetation cover and forest area so as to use more CO2 in photosynthesis.

→ Reducing release of N2O from agricultural fields by minimizing use of nitrogen fertilizers. More attention should by paid on nitrogen fixing organisms.

→ Replacing chlorofluorocarbons with chemicals which do not possess greenhouse effect.

Ozone Layer Depletion (Stratospheric Ozone Depletion):
Stratosphere O3 layer

→ Ozone is triatomic gas with a formula O3. It is formed independently in the troposphere and stratosphere. In the stratosphere, O2 splits up into nascent oxygen (O) under the influence of UV radiations. Nascent oxygen combines with the molecular oxygen (O2) to form ozone O3 (Molina and Molina, 1992).

→ Ozone (O3) is formed naturally in the upper stratosphere by short wavelength ultraviolet radiation. Wavelengths less than 240 nanometers are absorbed by oxygen molecules (O2), which break up to give O atoms. The O atoms combine with other oxygen molecules to make ozone.

→ Photodissociation of oxygen and ozone dissipates major amount of UV radiations as heat. An equilibrium is produced between generation and destruction of O3 resulting in steady state concentration in the stratosphere at a height of 20-26km above the sea level.

2nd PUC Biology Notes Chapter 15 Biodiversity and Conservation

Ozone Hole:

It is not an actual hole but an area of extreme reduction in ozone concentration in the ozone shield. Ozone hole was first discovered in 1985 by Farman et al over Antarctica. A small hole was also discovered over Arctic in 1990. Ozone holes are not permanent. They ‘ appear during polar springs. ODS. Certain substances react with ozone present in the stratosphere and destroy the same. They are called ozone depleting substances or ODS. The major ODS are chlorofluorocarbons (CFCs), halons (gases used in fire extinguishing like bromochloro- difluoromethane, N2O, CH4, chlorine, etc. They are either released by jets and rockets in the stratosphere or slowly pasainto stratosphere from troposphere. Both halons and CFCs produce active chlorine (CIO) in the presence of UV-radiations.

A small amount of atomic chlorine, Cl, and chlorine monoxide, ClO, which can catalyse the destruction of ozone by a number of mechanisms. The steps are

Step 1: “Photolysis” (splitting by sunlight) of CFC’s in the stratosphere
Cl2CF2 + UV light → ClCF2 + Cl

Step 2 : Catalytic destruction of ozone
Cl + O3 → ClO + O2
CIO + O3 → Cl + 2O2

Effects of ozone depletion:
Thinning of ozone layer and development of ozone holes increases the amount of UV-B radiations reaching the earth’s surface. A 5% ozone depletion increases UV-B radiations by 10%. Increased incidence of UV-B radiations on earth will have the following adverse effects.

→ Skin Cancers: There is an increase in the incidence of skin cancers. 1% fall in ozone concentration increase UV load of earth by 2% that causes addition of 50,000 cases of skin cancer. In Australia which lies near the area of ozone hole, every second middle aged person suffers from skin cancer while in old persons the incidence is nearly 100%.

→ Blinding: Many land animals would lose their eye sight and become blind. In human beings the cases of photo-burning, cataract and dimming of eye sight are on the increase. 1% fall of ozone concentration in stratosphere will blind another 1 lakh persons.

→ Immune System: It is partially suppressed. Incidence of herpes and other immune system related diseases are likely to increase.

→ Larval Stages: More larvae and young ones of aquatic animals will die.

→ Photosynthesis: Photosynthetic machinery is impaired. Photosynthesis decreases by 10-25%. There is a corresponding fall in the yield of crops.

→ Nucleic Acids: UV radiation damages nucleic acids by forming dimers. Incidence of harmful mutations increases.

→ Phytoplankton: Both photosynthetic activity as well as function of phytoplankton are disturbed by UV-radiations. 6-22% fall in productivity will occur.

→ Global Warming: Decreased primary productivity over land and inside oceans will increase carbon dioxide concentration resulting in global warming, despite reduction in CO2 emissions from industries and automobiles.

→ Deforestation: Removal, decrease or deterioration of forested area is called deforestation. Deforestation has been going on since the beginning of civilization. The decline has been maximum in the tropics (more than 40%) and minimum in temperate regions (1% or less).

→ The reasons for deforestation are several:

  • Demand for wood for fuel, timber and paper,
  • Building of dams and reservoirs for hydroelectric projects,
  • Overgrazing,
  • Human settlements,
  • Forest fires,
  • Practice of shifting cultivation,
  • Mining and quarrying,
  • Digging of canals,
  • Building of roads, etc.

2nd PUC Biology Notes Chapter 15 Biodiversity and Conservation

Causes of deforestation:
→ Slash and Burn agriculture/ Jhum cultivation: It is ‘an agricultural technique in which an area of forest is cleared by cutting and burning and is abandoned to return to a more natural state over time’.

→ It is also known as shifting cultivation,- swidden agriculture, or simply jhum.

→ Here, the farmers cut down trees and burn the plant remains. The ash is used as fertilizer and the land for grazing and farming.

Population growth: It is a major cause and in order to meet the immediate needs of growing population, forests are indiscriminately exploited for, timber, wood, paper, fuel etc.
Cattle are allowed to graze for a year or two. Once the soil is exhausted by over grazing, they move on to the next area

Extensive fire wood collection: Fire wood is the primary fuel for cooking and heating in developing countries. The outright destruction of living trees to meet fuel need occurs most commonly around cities and towns.

Effects of deforestation:

  • Global warming,
  • Soil erosion and flooding,
  • Drought and desertification,
  • Decrease in rainfall,
  • Loss of microorganisms,
  • Loss of unique species,

Reforestation: Reforestation is the process of restoring a forest that once existed but was removed at some point of time in the past. Reforestation may occur naturally in a deforested area.
Afforestation is growing trees for the first time in treeless regions.

Waterlogging and soil salinity: Irrigation without proper drainage of water leads to waterlogging in the soil. Besides affecting the crops, waterlogging draws salt to the surface of the soil. The salt is then deposited as a thin crust on the land surface or starts collecting at the roots of the plants. This increased salt content is inimical to the growth of crops and is extremely damaging to agriculture.

Case study of people’s participation in conservation of forests:
People’s participation has a long history in India. In 1731, the King of Jodhpur in Rajasthan asked one of his ministers to arrange wood for constructing a new palace. The minister and workers went to a forest near a village, inhabited by Bishnois, to cut down trees. The Bishnoi community is known for its peaceful co-existence with nature.

The effort to cut down trees by the King was thwarted by the Bishnois. A Bishnoi woman Amrita Devi showed exemplary courage by hugging a tree and daring King’s men to cut her first before cutting the tree. The tree mattered much more to her than her own life. Sadly, the King’s men did not heed to her pleas, and cut down the tree along with Amritha Devi. Her three daughters and hundreds of other Bishnois followed her, and thus lost their lives saving trees.

Now here in history do we find a commitment of this magnitude when human beings sacrificed their lives for the cause of the environment. The Government of India has recently instituted the Amrita Devi Bishnoi Wildlife Protection Award for individuals or communities from rural area that have shown extraordinary courage and dedication in protecting wildlife.

You may have heard of the Chipko Movement of Garhwal Himalayas in 1974, local women showed enormous bravery in protecting trees from the axe of contractors by hugging them. People all over the world have acclaimed the Chipko movement.

2nd PUC Biology Notes Chapter 15 Biodiversity and Conservation

Realising the significance of participation by local communities, the Government of India in 1980s has introduced the concept of Joint Forest Management (JFM) so as to work closely with the local communities for protecting and managing forests. In return for their services to the forest, the communities get benefit of various forest products [e.g., fruits, gum, rubber, medicine, etc), and thus the forest can be conserved in a sustainable manner.

2nd PUC Biology Notes

2nd PUC Biology Notes Chapter 15 Biodiversity and Conservation

Karnataka 2nd PUC Biology Notes Chapter 15 Biodiversity and Conservation

Introduction to Biodiversity:

→ There are various types of organisms present around us. Some are very small like bees, ants, insects and other are very large like elephant, banyan tree, etc.,, and some organisms are so small that they cannot be seen by naked eyes. This variety in the shape, form and nature of different organisms constitute biodiversity. The term ‘biodiversity’ refers to the totality of genes, species and ecosystems of a region.

→ The biodiversity therefore includes different types of genes, different types of organisms, species and ecosystems. The distribution of organisms is not even. It depends upon the habit and habitat of the organism. Therefore, biodiversity differs from place to place. Taking into consideration the total habitats of plants and animals, we can say that the living world abounds with enormous biodiversity. Loss of biodiversity would inhibit the evolutionary capability of biota to cope up with environmental changes.

2nd PUC Biology Notes Chapter 15 Biodiversity and Conservation

Magnitude of Biodiversity:

→ The predicted number of total species on this earth varies from 5 to 50 million and average at 14 million, but only 1.7 million have been described till today and the distribution is highly uneven.

→ About seven percent of the world’s total land area is hofne to half of the world’s species, with the tropics alone accounting for 5 million.

→ About 61 percent of the known species are insects, but, only 4650 species of mammals are known to us.

→ A large number of plant species (2,70,000) and vertebrates are known.

→ About 40,000 species of algae and 72,000 species of fungi are known.

→ About 2,50,000 species of angiosperms are known but only 750 species of Gymnosperms are familiar to us.

→ Information about bacteria, viruses, protists and archaea is just fragmentary. However, new species are being discovered faster than ever before due to the efforts of projects like Global Biodiversity.

Levels of Biodiversity:

Biological diversity includes three hierarchical levels: Genetic diversity, species diversity and community or ecosystem diversity.

Genetic diversity: The number and nature of genes determine the characters of the organisms. No two individuals have exactly the same genetic makeup. This difference among the genes of two different organisms is called genetic diversity.

Species diversity:
→ Species is a group of similar individuals, which are able to interbreed and produce fertile hybrids.

→ All the members of a particular species have almost similar characters, but they differ markedly from the members of another species. This variation in the members of two different species in a region is called species diversity.

Community and ecosystem diversity:
Genetic and species diversities finally give rise to community and ecosystem diversity. Diversity at the level of community and ecosystem has three perspectives.

  1. Alpha diversity
  2. Beta diversity and
  3. Gamma diversity.

1. Alpha diversity: Alpha diversity refers to the diversity of organisms in the same community or habitat. (It is therefore intra-community diversity). This type of diversity is represented by a combination of species richness and species evenness.

2. Beta diversity: Species undergo frequent changes when the habitat or environmental conditions get changed. Due to this, a species in a given area may be replaced by some other species. The rate of replacement of species along a gradient of habitats or communities is called beta diversity (It is therefore inter-community diversity).

3. Gamma diversity: Diversity of the habitats over the total landscape or geographical area is called gamma diversity. Ecosystem diversity describes the number of niches, tropic levels and various ecological processes that support energy flow, food webs and the recycling of nutrients. It focuses on various biotic interactions, the role and function of keystone species.

Studies show that, diverse communities are functionally more productive and stable. Even under changing environmental conditions, diverse communities exhibit greater stability.

2nd PUC Biology Notes Chapter 15 Biodiversity and Conservation

Patterns of Biodiversity:
→ Biodiversity is not uniform throughout the world but varies with change in latitude and altitude.

→ Favourable environmental conditions favour speciation and make it possible for aTarger number of species to exist there; i.e., biodiversity is more in such areas than in others.

(a) Latitudinal Gradients:
→ Species diversity decreases from equator towards poles.

→ The tropics (between 23,5°N to 23.5°S) harbour more species than temperate and polar regions.

→ For example, Columbia situated near equator, has about 1400 species of birds, while New York (4ION) has 105 species, Greenland (7ION) has about 56 species and India (in the equator region) has 1200 species.

→ The number of species of vascular plants in tropics is about ten times more of that of temperate forests.

→ The Amazonian rain forest in South America has the greatest biodiversity on earth; it harbours about 40000 species of plants, 1,25,000 species of invertebrates, 3000 of fishes, 427 of amphibians, 378 of reptiles, 1300 of birds and 427 of mammals.

→ Three hypotheses have been proposed to explain the difference in biodiversity between tropical and temperate regions; they are as follows :
1. Speciation in general, is a function of time; while temperate regions were subjected to frequent glaciation in the past, the tropics have remained undisturbed and hence had evolved more species diversity.

2. As compared to temperate region, tropical environments are less seasonal, relatively more constant and predictable; such constant environments have promoted niche specialization and greater species diversity.

3. There is more solar radiation available in the tropical region; this contributes directly to more productivity and indirectly to greater species diversity.

(b) Species-Area relationship:
→ Alexander Von Humboldt has observed that within a region, species richness increased with increasing explored area, but only upto a limit.

→ The relationship between species richness and area for a number of taxa like angiospermic plants, freshwater fishes and birds is found to be a rectangular hyperbola.

→ On a log scale, the relationship becomes linear (straight line) and is described by the equation, log S= log C + Z 1 OgA, where
S = Species Richness
Z = slope of the line (regression coefficient))
A = area and
C = y – intercept

→ Ecologists have found out that the value of Z-line ranges between 0.1 and 0.2 irrespective of the taxonomic group or the region.

→ But this analysis in very large areas like a continent, shows the slope to be much steeper and the Z value ranges between 0.6 and 1.2.

→ The Z value for frugivorous birds and mammals in the tropical forests is found to be 1.15.
2nd PUC Biology Notes Chapter 15 Biodiversity and Conservation 1

2nd PUC Biology Notes Chapter 15 Biodiversity and Conservation

Uses of Biodiversity:

Mankind derives various benefits from the biological diversity existing around him. They are

(a) Economic benefit: These are direct in obtaining food, fibre, firewood, timber wood (for ’ construction), gums, resins, tannins, rubber, pharmaceuticals etc.

(b) Drugs and Medicines: A number of drugs are based on plant products. Rosy periwinkle (Catharanthus roseus : Vincarosea) yields alkaloids (vincristine and vinblastine) which are useful for treatment of leukaemia. Morphine (Papaver somniferum for pains), quinine (from bark of Cinchona ledgeriana for malaria), taxel (from bark of Yew, Taxas brevifolia and Taxus baccatq for treating cancers) etc.

(c) Aesthetic value: Biodiversity has a lot of aesthetic and attraction value, Ecotourism, bird watching, wildlife, pet keeping and gardening are all rewards of aesthetic value of biodiversity.

(d) Cultural benefit: Historically people have linked themselves with certain specific plants and animals. Majority of the Indian homes have specimens of Ocimum sanctum (Tulsi) growing in pots. Trees of Ficus religiosa (Peepal) and Prosopis cinerama (Khejri) are held sacred. They are planted and worshipped . Many birds and snakes are considered sacred and are worshipped.

(e) Ecological benefits or Ecosystem services: Forests and oceanic systems control climate and maintain the gaseous composition of the atmosphere. Oxygen is replenished through photosynthesis and carbon dioxide levels are lowered. Storage and retention of rain waters of aquifers and reservoirs and maintenance and purification of water regimes in soil and atmosphere is due to forests and vegetation. It helps in control of floods and soil erosion. The ecosystem services are valued at 16 – 54 trillion dollars per year.

Loss of Biodiversity:

The major causes of biodiversity losses are:

(a) Habitat loss and fragmentation : Habitats are destroyed by many human activities. It is the primary cause for loss of biodiversity of habitat. Human settlements, harbors, dams, reservoirs, roads, railway lines, industries, mines etc. , have reduced the natural habitats of wild life. Fragmentation develops barriers which limit potential of one species to colonize new areas. The species now becomes more vulnerable to extinction by means of fire, wind and predators. Deforestation leads to decrease in population of species and also reduces the area of free movement of wild animals, and this may lower their reproductive capacity. Environmental pollution has degraded many important habitats, resulting in decrease in life.

(b) Over-exploitation: Humans have always depended on nature for food and shelter, but when’ need’ turns to ‘greed’, it leads to overexploitation of natural resources. Extinctions of Steller’s cow, passenger pigeon were due to over exploitation by humans.

(c) Alien species invasions: Intentional or chance introduction of exotic species info new islands or countries by man adversely affects the native species. The Nile perch introduced into Lake Victoria led to.the extinction of more than 200 species of cichlid fish in the lake.

(d) Co-extinctions: Co extinction of a species is the loss of one species upon the extinction of another. An example is the case of a coevolved plant-pollinator. Mutualism where extinction of one invariably leads to the extinction of the other.

RED data book:

→ The IUCN (International Union of conservation of Nature and Natural Resources) now called WCN (World Conservation Union) maintains a document called Red List or Red Data Book of taxa that are facing the risk of extinction.

→ The basic utility of Red List is

  • To create awareness about the importance of threatened biodiversity.
  • To provide global index about the existing decline of biodiversity.
  • Identification and documentation of endangered species.
  • To highlight conservation priorities and to guide in conservation action.
  • To provide information about international agreements such as the convention on Biological Diversity and convention on International Trade in Endangered species of Wild Faun a and Flora.

→ IUCN has recognized eight Red List categories of species namely, extinct, extinct in the wild, critically endangered, endangered, vulnerable, lower risk, data deficient and not evaluated. IUCN Red List (2004) documents the extinction of 784 species in the last 500 years. Recent extinctions include dodo bird, gagger, thylacine, Steller’s sea cow and three sub-species of tigers.

→ Many species in India are under endangered list e.g., Great Indian bustard, pink-headed duck, musk deer, one-horned rhinoceros, lion tailed macaque, Kashmir stag etc.

2nd PUC Biology Notes Chapter 15 Biodiversity and Conservation

Conservation of biodiversity:

Biodiversity is very important for us and for the proper maintenance of nature. Therefore, it becomes necessary for us to protect our biodiversity. We also have a moral duty to look after our planet and pass it on in good health to our future generations. We should not deprive the future generations from the economic and aesthetic benefits that they can derive from biodiversity.

Strategies of biodiversity conservation :
There are two basic strategies of biodiversity conservation: insitu (on site) conservation and exsitu (off site) conservation.

I. Insitu conservation strategies
→ The in situ strategies involve the protection of total ecosystems (i.e., conservation of species in their natural environment).

→ For this several protected areas, biosphere reserves, sacred forests and lakes have been recognized which include a group of typical ecosystems.

1. Protected area conservation:
→ These are areas of land and sea, which are especially dedicated to the protection and maintenance of biodiversity and natural and cultural resources. These are managed through legal or other effective means. Examples of protected areas are National Parks, and Wildlife Sanctuaries.

→ According to world conservation Monitoring Centre, there are 3 7,000 protected areas around the world. India has 58 \ protected areas (89 National Parks and 492 Wildlife Sanctuaries).

→ These cover about 4.7 per cent of the land surface, as against 10 per cent internationally suggested norm. The Jim Corbett National Park was the first National park established in India.

Benefits of protected areas :

  • Maintenance of viable populations of all native species.
  • Maintenance of the number and distribution of communities and habitats.
  • Conservation of genetic diversity of all the present species.
  • Prevention of artificially introduced alien species.
  • To help species/habitats to shift in response to environmental changes.

2. Biosphere Reserves:
→ Biosphere reserves are specialized protected areas, which represents natural biomes and contain unique biological communities.

→ The concept of Biosphere Reserves was given in 1975 as a part of UNESCO’s Man and Biosphere Programme (MAB).

Construction of a biosphere reserve:
→ A biosphere reserve consists of the following zones:

→ The core zone: It is the inner central part comprises of an undisturbed and legally protected ecosystem.

→ The Buffer zone: It lies in the middle and surrounds the core zone. It is managed to accommodate, a greater variety of resources and support educational activities and research.

→ The transition zone: It is the outermost part of the biosphere reserve. In this zone, there is active cooperation between the reserve management and the local people and activities like settlement, cropping, forestry, recreation, etc continue to take place. Till May 2002 there were 408 biosphere reserves located in 94 countries.

2nd PUC Biology Notes Chapter 15 Biodiversity and Conservation

Intentions of a biosphere reserve:
The basic intentions of biosphere reserves are, Conservation: A biosphere provides protection to landscape, ecosystems, biotic communities, species and genetic resources and thereby ensure the conservation.

Development: Biosphere reserves promote the economic development. This intum also promotes social and cultural development.

Scientific research and education: Biosphere reserves are very important from the educational point of view. They help researchers and students to monitor and study biodiversity very closely.

3. Sacred forests and sacred lakes:
→ These are the undisturbed areas, which are protected by tribal people due to some religious causes.

→ Sacred forests (pristine forests) are the most undisturbed forests, free from any human intervention.

→ Some water bodies (lakes) have also been declared sacred by the people and it has led to the protection of aquatic flora and fauna, e.g., Khecheopalri Lake In Sikkim.

Note: Hotspots: A hotspot region ‘is one “which contains at least 1,500 species of vascular plants as endemics, and has lost = 70% of its original native habitat.

In India, there are three hotspots namely, north-western and eastern Himalayas, Western Ghats.

II. Ex-situ conservation strategies
The ex-situ conservation strategies include the conservation of biodiversity in artificially developed areas such as botanical gardens, zoos or zoological parks and conservation stands. Besides storing of germplasm (in gene or DNA banks), pollen grains, seeds and tissue cultures etc.., are also treated as ex-situ conservation methods.

1. Botanical gardens: These are the large artificially made natural surroundings where a large number of plant species are kept. Botanical gardens are significant for their plant diversity. There are more than 1500 botanical gardens in the world. Some important are described below.

a. Royal Botanical Garden Kew: It is the largest botanical garden of the world. It is located at Kew (England) and was founded in 1759 by Willium Aiton. It has about six million specimens of plants.

b. Museum of Natural History: It is located in Paris (France). It also contains about six million specimens of plant species.

c. New York Botanical Garden: It is located in New York (USA) and was founded in 1801. it contains about 405 million specimens of plants species.

d. British Museum of natural history: It is located in London. It contains more than 4 million plant specimens.

e. Indian Botanical Garden: It is situated in Kolkata, India. It is the biggest botanical garden of lndia. lt contains about 1.5 million plant specimens.

  • Botanical garden provides the visitor to compare plants in their natural living conditions
  • Botanical garden provides material for botanical research.
  • Botanical garden provides on the spot education about the plants.
  • Botanical garden provides shelter to endangered species.
  • Botanical garden acts as a huge library of plants.

2. Zoological parks: Zoological parks and gardens are the protected and enclosed areas, which are, developed to provide shelter to wild animals. Main object of creating the zoological parks is to create among people an interest and curiosity for animals. Various types of animals are kept in a zoological park for their protection, exhibition and study purposes.

Zoological parks are mainly run by the central and state governments. However some Non-government organizations (N.G.Os) are also active in this direction. Zoological parks guard animals against their natural enemies and also against starvation. They are also given medical treatment and facilities.

2nd PUC Biology Notes Chapter 15 Biodiversity and Conservation

Some important zoological parks of India are:

  • Zoological Garden, Kolkata.
  • Zoological Park, Itanagar, Arunachal Pradesh.
  • Zoological garden, Bikaner, Rajasthan.
  • Nehru Zoological Park, Hyderabad.
  • Nandan Kanan Zoological park, Bhuvaneshwar, Orrisa.
  • Prince of Wales Zoological Garden, Lucknow.
  • National Zoological Park, Delhi.
  • Sephijala Zoological Park, Tripura.
  • Kamla Nehru Zoological Garden, Ahmedabad.
  • Indira Gandhi Zoological Park, Vishakhapattanam.

3. Storage of seeds, pollen and tissue cultures: The structures like seeds, pollen and tissue cultures of important and endangered species can be protected by storing them at a very low temperature. The storage of materials at very low temperature (-196°C) is called cryopreservation. This temperature is usually achieved with the help of liquid nitrogen.

4. Gene or DNA banks: The germ plasm or genes (DNA) of important species can also be stored in gene or DNA banks. These banks help genetic engineers and plant and animal breeders to quickly obtain the genetic material of their choice.

2nd PUC Biology Notes

2nd PUC Biology Notes Chapter 14 Ecosystem

Karnataka 2nd PUC Biology Notes Chapter 14 Ecosystem

→ The term ‘ecosystem’ was coined by Sir Arthur Tansely (1935). It is a functional unit of nature, where living organisms interact among themselves and also with their physical environment.

→ Ecosystems vary greatly in size such as a small pond to a large forest or a sea.

2nd PUC Biology Notes Chapter 14 Ecosystem

→ The global ecosystems are grouped into two categories

  1. terrestrial or land ecosystems (e.g., forests, grasslands, deserts, gardens), and
  2. aquatic or water ecosystems (e.g., freshwater ponds, t lakes, wetlands, rivers, streams, estuaires, oceans). The ecosystems which develop in nature without human support or interference are called natural ecosystems.

Note: While the ecosystems created and maintained by human beings are termed as r anthropogenic or manmade ecosystems.
e.g., crop fields, aquarium, space craft.
2nd PUC Biology Notes Chapter 14 Ecosystem 1

Ecosystem Structure:

The interaction of biotic and abiotic components results in a physical structure that is characteristic for each type of ecosystem. Following are the major structural features of an ecosystem:

1. Species composition: Different ecosystems have different species composition which depends upon geography, topography and climate. A great variety of species is found in tropical rainforests and coral reefs, whereas, only a few species occur in deserts and arctic regions.

2. Stratification: It is the vertical distribution of different species, occupying different levels in an ecosystem. For example, in a forest, trees occupy the top vertical strata, shrubs the second and herbs and grasses occupy the bottom layers.

3. Trophic organization: Food relationship of producers and consumers is another way to depict ecosystem structure. The producers form the first trophic level or T1, the herbivores the second or T2, and carnivores constitute the third or T3 The top carnivores belong to T4 or T5 trophic levels.

4. Standing crop: It is the amount of living material present in different trophic levels per unit area at a given time. It is generally expressed in dry weight, as the frefh weight is liable to fluctuate due to seasonal moisture.

5. Standing state: It is the amount of nutrients present anytime in the soil of ecosystem. It tends to vary from season to season and ecosystem to ecosystem.

2nd PUC Biology Notes Chapter 14 Ecosystem

Ecosystem Function:

The Components of an ecosystem function as a unit with a number of delicately balanced and controlled processes. The important functional aspects of an ecosystem are:

  • Productivity
  • Decomposition
  • Energy flow and
  • Nutrient cycling.

Productivity:
→ A constant input of solar energy is the basic requirement of any ecosystem to function and sustain.

→ Primary productivity is expressed in terms of gm2 yr-1 or k Cal m-2 y-1,

→ Primary productivity has two aspects :

  1. Gross Primary Productivity (GPP) is the rate of production of organic matter during photosynthesis.
  2. Net Primary Productivity (NPP) is the amount of energy left in the producers after utilisation of some energy for respiration, i.e., GPP’ – R = NPP. It is the amount of energy available in the producers, for the consumption of herbivores.

→ Primary productivity depends on,

  • the plant species in a particular area,
  • availability of nutrients,
  • photosynthetic capacity of plants and
  • a number of environmental factors.

→ The annual net primary productivity of the whole biosphere is approximately 170 billion tons (dry weight) of organic matter.

→ Of this, the productivity of oceans is only 55 billion tons, while the rest is from land.

→ Secondary productivity is defined as the rate of assimilation and formation of new organic matter by consumers.

Decomposition:
→ Detritus is the raw material for decomposition.

→ Following are the steps in the’process of decomposition :

  • Fragmentation: It is the process of breaking of the detritus into smaller particles by detritivores.
  • Leaching: It is the process in which water-soluble inorganic substances run down into soil profile and get precipitated as unavailable salts.
  • Catabolism: The enzymatic conversion of the detritus into simple organic compounds and then into inorganic compounds, is called catabolism. The enzymes are secreted by the decomposers like bacteria and fungi.
  • Humification: Humification during decomposition leads to the accumulation of a dark coloured amorphous substance called humus.
  • Mineralisation: It is the process in which the humus is degraded by certain microbes and the inorganic nutrients are released.

→ Decomposition is largely an aerobic process, i.e., it requires oxygen.

→ The factors affecting decomposition are :

  • The chemical composition of detritus and
  • The climatic factors.

→ If detritus is rich in lignin and chitin, decomposition is slow and it is faster if detritus is rich in nitrogen and water-soluble substances.

→ Temperature and soil moisture are the important climatic factors that regulate decomposition through their effects on the activities of soil microbes.

→ Warm and moist environment favours decomposition, while low temperature and anaerobic conditions inhibit decomposition.

2nd PUC Biology Notes Chapter 14 Ecosystem

Energy Flow(Food Chain):
The primary source of energy for all living organisms in ecosystem is sunlight. The only living organisms capable of converting light energy into food molecules are green plants, hence they are called producers (P). It is for the food energy that the producers are eaten by all types of consumers. The process of flow of food energy from producers through a series of consumers by repeated eating and being eaten is called the food chain. The steps or links involved in food chain are called trophic levels [T].

Trophic Level:
Trophic level is described as the nutritional level of an individual in a food chain that indicates the specific food habit, e.g. Caterpillar, grass hopper, rabbits and elephants are grouped under same trophic level since all of them are herbivores, they feed directly on plants as food source.

The green plants (producers) occupy first trophic level (T1), while the animals of C1, C2 and C3 occupy successive trophic levels namely T2, T3, T4 respectively in a food chain. At each trophic level food energy is used up for metabolic activities and only 10% of it is available for the next trophic level. Thus energy level decreases considerably at successive trophic levels. Hence smaller the food chain or less the number of trophic levels, greater will be its available energy.

Types of food chains:
There are 3 main types of food chains in nature namely,

1. Predatory food chain: It starts with green plants (producers) and proceeds from smaller animals (herbivorous) to larger animals (carnivorous). Since it involves grazing of plants by herbivores, it is also called grazing food chain. It explains predatory to prey relations. It includes the following examples.
2nd PUC Biology Notes Chapter 14 Ecosystem 2

→ Pond food chain:
2nd PUC Biology Notes Chapter 14 Ecosystem 3

→ Forest food chain:

  • Green plants → Deer → Tiger.
  • Green plants → Rabbit → Wolf → Tiger.

→ Grass land food chain:
2nd PUC Biology Notes Chapter 14 Ecosystem 4

→ Marsh land food chain:
2nd PUC Biology Notes Chapter 14 Ecosystem 5

2nd PUC Biology Notes Chapter 14 Ecosystem

2. Parasitic food chains
It starts with producers and passes from larger animals (hosts) to smaller animals, (parasites). It explains host-parasite relationship. Examples:-

  1. Green plants → Man (Host) → Intestinal round worms (endoparasites).
  2. Grass → Sheep (Host) → Liver fluke (endoparasite).
  3. 2nd PUC Biology Notes Chapter 14 Ecosystem 6
  4. Grass → Horse → Roundworm (Ectoparasite)

3. Saprophytic food chain (Detritus food chain):
It starts with dead bodies and proceeds further from decomposers to detrivores which explains the recycling of matter, e.g. Dead bodies.
1. Dead bodies → Decomposers → Detriveres.
(Detritus) T1 (Bacteria & Fungi) T2 (Millipedes and earthworms) T3.

2. Mangroove trees → Dried leaves → Ocean → Bacteria and fungi → Crabs and Snails.

Food Web:
Food chains remain inter connected at various levels. The web like inter locking system of several food chains in a community is called food web, This maintains ecological homeostasis. It allows an organism to feed on two or more organisms of the lower trophic level and provides for survival of organisms.

Ecological Pyramid:

→ It is the graphic representation of trophic structure and function of a food chain. It is so called due to its superficial resemblance to Egyptian pyramid. The Pyramid concept in ecology was proposed by Charles Elton and hence they are also called Eltonian pyramids.

→ It is usually broad below and tapering to on apex above. Producers occupy the broad base, while animals are consumers occupy successive steps tapering into the apex of the pyramid. There are 4 types of ecological pyramids namely.

1. Pyramid of Number:
It is graphic representation of numerical relationship between successive trophic levels „ in a food chain. Usually it is an upright pyramid and it illustrates decreasing number of individuals at successive trophic level from producers to consumers. Number of individuals is maximum in producers compared to consumers, e.g.: Pond food chain.

2nd PUC Biology Notes Chapter 14 Ecosystem 7
Pyramids numbers. (A) In a grassland ecosystem. (B) in a pond ecosystem

2nd PUC Biology Notes Chapter 14 Ecosystem

2. Pyramid of Biomass:
It is graphical representation of biomas at successive trophic level in a food chain. Biomas is the total dry weight of an organism or all organisms of a trophic level. It is expressed as pounds or kilograms. Usually it is an upright pyramid and illustrates decreasing biomas at successive trophic levels from producers at the base to the consumers. Biomas of producers is maximum. It is less in Consumers, e.g.: Pond food chain.

2nd PUC Biology Notes Chapter 14 Ecosystem 9

3. Pyramid of Energy:
It is graphic representation of available energy at successive trophic levels in a food chain. Energy level is expressed as kilocalorie. It is the typical upright pyramid. It illustrates decreasing energy level at successive trophic levels from producers at the base to the consumers. Energy level is maximum in producers, less in consumers, e.g.: Pond food chain.

4. Pyramid of a parasitic food chain (Inverted Pyramid):
In the case of parasitic food chain the pyramid of number becomes inverted, e.g. A single large tree (T1) feeds and shelters several fruit eating birds (T2). They further feed and shelter many ecto parasites (ticks & fleas) T3. These in turn, feed and shelter numerous hyperparasites (Bacteria and fungi) T4. Thus it indicates the increasing number of individuals at successive trophic level from base to apex resulting in an inverted pyramid with tapering base below and broad apex above.

Ecological or Biotic Succession:

→ The occurrence of relatively definite sequence of communities over a long period of time in the same area resulting in establishment of stable or climax community is known as ecological or biotic succession.

→ The first community which inhabits the area will be referred to as ‘pioneer community’ and the last and stable community formed in the area will be referred to as ‘climax community’. The intermediate communities are called ‘transitional or serai communities’. The whole series of changes in community characteristics from pioneer stage to climax stage constitutes a ‘sere’ and the intermediate stages are the ‘serai stages’.

→ Usually the initial stages of succession are comprised of lower forms.

→ Causes of ecological succession are classified under two categories: Biotic Factors and Physiographic Factors.

→ Interactions among the organisms in a community, called as biotic factors, influence the structure, composition and function Of a community. In succession, over a period of time a community makes the area less favourable for itself and more favourable for the next serai community .

→ Physiographic factors include physical and chemical factors of the environment such as landslides, erosion, catastrophic factors, etc.

→ Basic types of succession : primary succession and secondary succession.

2nd PUC Biology Notes Chapter 14 Ecosystem

Primary successio :
→ It is also referred as ‘perisere’. It is a type of biotic succession that occurs on a substratum devoid of life earlier like bare rock, sand dunes, new island exposed out of the sea etc, where there was previously no life forms.

→ Primary succession takes a very long time (more than thousands of years in case of climax forest on bare rock). Process of primary succession occurs through a number of sequential steps, which follow one another. They are nudation, invasion, migration, ecesis, aggregation, competition, reaction, and stabilization.

Secondary successions:
→ It is the biotic succession that occurs in an area, which had an existing biotic community and has become bare due to destruction by fire, landslide, earthquake etc.

→ The sequence of successional stages is called ‘subsere’, and time required for the completion of sere is much shorter than primary succession.

Stages of Ecological Succession in a Hydrosere:
It involves the ecological succession in a newly formed pond, lake (or any open water areas) and successional series progress from hydric to the mesic conditions. It involves the following ecological succession.

→ Pioneer stage: The pioneers are phytoplankton consisting of unicellular and colonial forms of green algae near the surface of water. They are followed by zooplanktons like Amoeba, Paramecium and Vorticella. Death and decomposition of phytoplankton and zooplankton produces organic matter which mixes with the silt and form a soft mud which favours the growth of next stage of plants.

→ Submerged stage: In a pond or lake, where water is less than 10 feet deep, there may be entirely submerged and free floating plants and some submerged and rooted at the bottom, e.g., Hydrilla, Vallisneria, Elodea, Ceratophyllum etc.

Death and decay of these plants and dead materials sinking to the bottom and addition of sand and silt around the plants results in rise of soil at the bottom. This makes the pond or lake more shallow and unsuitable for the submerged species but suitable for rooted floating plants.

→ Floating stage: It consists of rooted hydrophytes with roots, rhizome or root stock attached at the bottom of the pond. Some of these plants have their leaves spread over the surface of water while some have free floating leaves e.g., Nymphaea, Nelumbo, Trapa, Salvia, Azolla etc. The large leaves of many of these plants cut off light to the submerged plants. Hence with very little light it becomes unsuitable for the growth of submerged plants. It results in building up of the bottom of the pond or lake and the edges become more shallow (1 – 3 ft).

→ Reed swamp stage : In shallow water marshy plants like Typha, Rumex, Sagittaria invade and establish. These plants are rooted at the bottom and are partly submerged but their shoots
2nd PUC Biology Notes Chapter 14 Ecosystem 9
extend well above the water. They cut light from the floating plants and they find it less favourable. Such plants die adding the organic matter to the soil. In course of time, the edge of the pond or lake is converted into water – saturated place (marshy place) favourable for the marsh – meadow stage.

→ Marsh – meadow stage (Sedge – meadow stage) Marshy edges with one or two inches of water of ponds or lakes favour the growth of members of family Cyperaceae and Gramineae such as Carex, Cyperus, Juncus, Eleocharis, Fucus, sedges and tall grasses, forming a meadow (mat) like vegetation. Slowly the surface water dries up and develops a mesic condition in the area and the marshy vegetation disappears gradually.

2nd PUC Biology Notes Chapter 14 Ecosystem

→ Woodland stage: In the moist climate, the woodland stage consists of shrubs and small trees like salix (shrubby willows), populus (cotton wood) and tree willows. The pioneers of this will be those that can tolerate partial water- lodged conditions around their roots. The woody plants in the region cast shade and make the soil dry by their vigorous transpiration and holding the wind – borne soil and accumulating plant debris. Mineralization and soil formation favours the growth of herbs among the shrubs and trees.

→ Forest stage: It is the climax stage during the course of time, in which the soil becomes rich in humus and organic matter and supports climax community. It may be tropical deciduous or monsoon forests in regions of moderate rainfall, tropical rain forests in areas with heavy rainfall and mixed forests of Quercus (oak), Acer and Alnus in temperate regions.

Stages of Ecological Succession in a Lithosere (XERARCH):

  • It is a type of xerosere that involves the ecological succession on bare rock surfaces.
  • Rocky surface is characterized by, deficiency of water, absence of organic matter and very high surface temperatures.

Stages of lithosere:
→ Crustose lichen stage: It forms the pioneer community in a lithosere and is represented by lichen species like Lacanora, Graphis, Rhizocarpus and Rinodina. These are resistant to dessication and high temperature. They produce organic acids which cause weathering of rocks so that minerals essential for further growth of lichens are released. The lichens hold the fine particles of rock along with the sand particles bought by wind in the depressions to initiate soil formation.

→ Foliose – lichen stage: The change in the rock made by the crustose lichens makes possible for the growth of foliose lichens such as Parmelia and Physcia. Their expanded thalli cover the crustose lichens which finally die and decay. Water and humus collect around the foliose lichens and the acids produced by them eat into the rock. It leads to the development of a fine soil layer on the rock surface which favour the growth of mosses.

→ Moss Stage: The accumulation of soil and humus as a thin layer on the surface of rock results in the growth of mosses like Poly trichum and Grimmia. These mosses being taller and gregarious, kill the lichens with their shade and replace them. Mosses break up, the rock further arid their bodies are added to the soil, increasing its thickness, fertility and water holding capacity.

→ Herb stage: The mat formed by mosses in the partially fragmented rock surface has greater water holding capacity. Many herbs, short lived annual, biennial and perennial and
xerophytic grasses make their first appearance. The roots of these plants accelerate the process of rock disintegration. The amount of soil increases as the death and decay of these increases the humus.

→ Shrub stage: The thick layer of soil with humus results in the growth of shrubs like Rhus, Zizyphus, Caparis etc. the roots of the shrubs further erode the rock which is more or less completely covered with soil. The soil is further enriched by humus formed from fallen leaves and twigs. All these conditions are favourable for the growth of trees.

→ Tree stage: It is the climax community in lithosere. The first tree species to appear are stunted and are spaced afar. Further weathering of rocks and increasing humus content of the soil favours the growth of more trees. The vegetation finally becomes mesophytic. It may result in a rainforest in a moist tropical area, coniferous forest or deciduous forest in temperate area and a grassland in area with less rainfall etc.

Bio-Geo Chemical Cycles / Nutrient Cycling (Inorganic – Organic Cycles):
They are the cyclic movements of essential chemical elements between the environment and
living organisms, establishing relationship among living organ isms, soil and chemical elements. It can also be defined as the specific circulation of inorganic matter / gases between the living and the non-living world.

I. Classification Based on the Type of Inorganic Matter:
1. Gaseous cycles : It refer to cycling of gases like carbon, nitrogen and oxygen between the environment and living organisms since their reservoir is atmospheric air. They are called gaseous cycle. They include carbon cycle, nitrogen cycle and oxygen cycle respectively.

2. Sedimentary cycle : They refer to cycling of mineral elements (Nutrients) between the environment and living organisms and hence they are also called nutrient cycles. Their reservoir is soil or sedimentary rocks. They include sulphur cycle, phosphorous cycle and calcium cycle.

2nd PUC Biology Notes Chapter 14 Ecosystem

II. Classification Based on the Efficiency of Circulation
1. Perfect cycle: Here, the inorganic – organic cycle is perfect, such that there is maximum utility and minimum wastage e.g. Carbon cycle.

2. Less perfect cycle : Here the inorganic – organic cycle is with the involvement of intermediate compounds such that there is moderate utility and wastage is observed, e.g. Nitrogen cycle.

3. Imperfect cycle: Here the inorganic – organic cycle is with the involvement of sedentary reservoirs, such that there is maximum wastage and minimum utility, e.g. Sulphur cycles, phosphorous cycles.

Carbon Cycle:
It is the cycling of carbon or carbon dioxide between the environment and living organisms. It is a type of gaseous cycle and it occurs as carbon dioxide in air and also dissolved in water. It is referred as the gaseous perfect cycle.

Green plants (producers) fix the carbon of the atmospheric carbon dioxide by photosynthesis and incorporate it in their food molecules as carbohydrates. Animals (Consumers) obtain the same from plants by feeding on them directly (Herbivorous) or indirectly (Carnivores) and incorporated in their organic substances as carbon skeleton.
2nd PUC Biology Notes Chapter 14 Ecosystem 10
It is in the same way that the dissolved carbon dioxide of water is used by aquatic plants and passed on to aquatic animals through*food chains. The carbon of organisms eventually returns to the atmosphere as carbon dioxide by the following events.

  • During respiration in both plants and animals.
  • During bacterial decomposition of dead bodies of plants and animals.
  • Combustion of fossilized plant products such as coal and oil deposits and forest fires.
  • Volcanic explosions.

2nd PUC Biology Notes Chapter 14 Ecosystem

Phosphorous Cycle:
It is cyclic movement of phosphorous as a nutrient between the environment and living organisms. It is sedimentary cycle. Its main reservoirs in nature are phosphate rocks, fossil bone deposits and guano deposits (hardened excreta of marine birds) from them, by weathering and volcanic eruptions. Phosphorous is released as inorganic phosphates into the soil and water. Much of these phosphates get washed into the sea where they are lost into deeper sedimentation.
2nd PUC Biology Notes Chapter 14 Ecosystem 11
Only some phosphates of soil and water are absorbed through roots by green plants (producers) and are used to form the important components of protoplasm, cell membrane, ATP and nucleic acids. These are obtained by animals (consumers) as they feed on producers directly (herbivores) are indirectly (carnivores) through food chains. In animals phosphorous is essential for teeth and bone formation. Bacterial decomposition of dead bodies of producers and consumers return the phosphorous as phosphates to the cycle to be recycled through organisms. Since much of the soil phosphates are lost to sedimentation leaving only some to be cycled through the organisms, phosphorous cycle is a good example for imperfect bio-geo chemical cycle.

Ecosystem services:

Ecosystem services are

  • Healthy forest ecosystems purify air and water.
  • Mitigate droughts and floods.
  • Cycle help in nutrients.
  • Generate fertile soils.
  • Provide wildlife habitat.
  • Maintain biodiversity.
  • Help to Pollinate crops.
  • Provide storage site for carbon and also provide aesthetic, cultural and spiritual values.

2nd PUC Biology Notes

2nd PUC Biology Notes Chapter 13 Organisms and Populations

Karnataka 2nd PUC Biology Notes Chapter 13 Organisms and Populations

Ecology

The term ecology was coined by H. Reiter (1868) and is defined by E.Haekel (1870) as a branch of biology which deals with the inter relationship and interactions between living organisms and their natural environment. (Smith 1947).

The Types of Ecology:

→ Autecology: It is the study, of an individual organism or particular species in relation with its natural environment.

→ Synecology: It is the study of (different species of plant and mammals) belonging to various populations in relation with their natural environment.

2nd PUC Biology Notes Chapter 13 Organisms and Populations

Levels of organization:
1. Population: Population is a local group of individuals of a species. Study of population is called demography, e.g., insect population, reptile population.

2. Community: Community is a localised collection of population of different species of plants and animals, e.g., plant community, animal community.

3. Biome: It is an unit of biosphere with a specific environmental condition to support and sustain a specific interaction of biotic and abiotic factors, e.g., pond biome, marine biome, estuarine biome, forest biome, grass land biome, desert biome.

4. Biosphere: It is the totality of earth with its life supporting environment. It consists of hydrosphere (water), lithosphere (soil), and atmosphere (air). Functionally biosphere is the collection of several ecosystems (Biomas).

5. Ecotone and Edge effect:

  • A transitional zone between the 2 eco-systems constitutes an ecotone.
  • It will be a mixture of environmental conditions of both the eco-systems. e.g., Grassland is an ecotone in the terrestrial habitat. Estuary is an ecotone in the aquatic habitat.
  • When we look at the flora (total plants) and fauna (total animals) in an ecotone, we can observe their increased number.
  • This increase of biota in an ecotonic habitat is called edge effect, e.g., Owl keeps its maximum number in grassland.

6. Ecological Dominance:
In a community of individuals, if the environmental conditions are supportive to one community, they may outnumber the others and dominate over the other communities. Such a phenomenon is called ecological dominance. It may be because of their number, size or biomass, e.g. In a forest the oak tree population has an ecological dominance.

7. Ecological succession: If the ecological dominance is magnified to succeed over the other community, it is called ecological succession that leads to the absence of the other community and growth of the ecologically dominant community only.

8. Climatic climax: Since climatic conditions are supportive for the ecological dominance and ecological succession, it is also called as climatic climax. Here climatic conditions are very vital in upholding ecological dominance.

9. Ecological niche: If the habitat of an individual is compared to the address, an ecological niche suggests the profession of an individual. It is a factor to describe the overall activities of an individual in its community and habitat. It is also a dynamic entity, that changes from place to place.

Any Eco system or Biomes is the sum total of all (living) and abiotic (non – living) factors.

2nd PUC Biology Notes Chapter 13 Organisms and Populations

Biotic Components:

Consists of producers [P], consumers [C] and decomposers [D], Producers include all green plants. Autotrophs capable of photosynthesis, synthesise food for themselves and for all organisms of the ecosystem. Producers of pond include macrovegetation and microvegetation.

Macrovegetation: It refers to large aquatic plants. They can be rooted , submerged or free floating. e.g.:Typha, Chara, Hydrilla.

Microvegetation: It refers to microscopic, free floating plants called phytoplanktons. They represent the bulk producers of the pond ecosystem, e.g.: Diatoms, volvox, nostoc, scytonema, chlamydomonas, anabena.

Consumers:

It includes all animals which are heterotrophs i.e. incapable of photosynthesis. They depend on producers for food, energy and food directly or indirectly. They are of three grades namely,
(a) Primary consumers (C1) – Zooplankton (Mosquito larva, tadpole) Daphnia, Desmids, Nematodes; Crustaceans.
(b) Secondary consumers (C2) – Water, beetles, hydra, small fishes , frog.
(c) Tertiary consumers (C3) -Bigfish, water snake.
(d) Decomposers – Bacteria and fungi (Saprophytes).

(a) Primary consumers: Also called herbivorous, feed on green plants directly for food and energy, and thereby regulate the population size qf producers. Their numbers and energy level would be greater than that of C2 . C1 of pond includes tadpoles, pond snakes and zooplanktons like cyclops, deaphuria, crustaceans, daphnia, nematodes cypris etc.,
2nd PUC Biology Notes Chapter 13 Organisms and Populations 1

(b) Secondary consumers : Also called primary carnivores, feed on C1 for food and energy thereby regulates the population size of Cr Their number and energy level would be much greater than that of C3. C2 of pond includes rotifers, hydra, water beetles, small fish and frogs.

(c) Tertiary consumers: Secondary carnivore feed on C2 for food and energy thereby regulate the population size of C2, their number and energy level would be least of all. C3 of pond include water snakes and big fish like carps and cat fishes.

(d) Decomposers : Saprotrophs feed on the dead bodies of plants and animals and reduce them into simpler chemical elements to be reused by producers for photosynthesis and as nutrients. Thus they serve in cycling of matter. Decomposers of pond include bacteria and fungi abundant in the muddy bottom of pond.

2nd PUC Biology Notes Chapter 13 Organisms and Populations

Abiotic Components:

Consists of sunlight, soil, water and its pH, temperature, dissolved gases like oxygen and carbon dioxide, mineral salts like P04, S04, N03, Na, K and Ca and organic substance like Humic acid, carbohydrates, fats.

Major abiotic factors:
1. Temperature:
→ It is the most important ecological factor affecting almost all the metabolic activities of the organisms. The metabolic activities begin at a certain minimum temperature and increase with increase of temperature, until they reach a maximum temperature called optimum. Further rise of temperature, is accompanied by a fall in the metabolic activity until it ceases at a maximum temperature. Most of the organisms can survive in a narrow range of temperature (0° – 35°C).

→ Effects of temperature on plants: The metabolic reactions, transpiration, mineral absorption and water uptake and reproduction in plants, are affected by changes in temperture. All metabolic reactions are controlled by enzymes and variation of temperature affects enzyme action. The rate of transpiration increases with the increase of temperature.

→ When the temperature is low, the minerals remain tightly attached to soil. Many species of plant show flowering with low temperature treatment and this phenomenon is called vernalization.

→ Equatorial region, tropics, temperate and polar regions have their own particular type of vegetation.

Effect of temperature on animals:
→ The variations of temperature seems to have remarkable effect on the metabolism of certain animals. Temperature affects the reproductive capacity of organisms and enzyme linked chemical reactions in the cells. Temperature also effects growth, development and morphology. It shows that different animals have different range of temperature tolerance. Based on this, animals are divided into the following categories.

→ Eurythermal organisms: These are the animals which can tolerate and thrive in a wide range of temperatures
e.g.: Cyclops, toad, man, lizards etc.

Stenothermal organisms:
→ These are the animals which tolerate only a narrow range of temperatures and the vast majority animals are stenothermal, e.g. : fishes, corals and snail.

2. Water:
→ The amount of water available, determines the type and distribution of plants in different areas. Water availability is so limited in deserts, that only plants with special adaptations (xerophytes) make it possible to grow there. The survival, productivity and distribution of plants mostly depend on water.

→ Even though there is a lot of water in the oceans, lakes, seas and rivers, the plants growing there face problem of quality of water. The chemical composition and pH of water becomes important in the distribution of plants. The salt concentration is less than 5 in inland waters, 30-35 in the seas and more than 100 percent in some hypersaline lagoons.

→ Based on the tolerance of salt, there are two types of organisms, euryhaline organisms which tolerate a wide range of’salinities and stenohaline organisms restricted to a narrow range of salinities. Many fresh water animals cannot live for long in sea water due to exosmosis of water from the cells and sea water animals cannot live in fresh water due to endosmosis of water.

2nd PUC Biology Notes Chapter 13 Organisms and Populations

3. Light:
→ Light is directly responsible for the growth, development and differentiation of plants. Sunlight is a source of energy for plants to produce food through photosynthesis. Intensity, quality and duration of sunlight controls the activities of both plants and animals. Certain plants require less intense light for optimum photosynthesis and grow in shady places. They are called shade tolerant species or sciophytes. On the other hand certain plants require high intensity for optimum photosynthesis. Such plants are called shade intolerant species or heliophytes.

Note: Extremely intense light results in photooxidation of cellular components including photosynthetic apparatus and finally their death. The phenomenon is called solarization.

→ The duration of sunlight in a day is called photoperiod and response of plants to this is called photoperiodism.

→ Light also affects movements of plants. Leaves of some leguminous plants fold up or droop at night. These movements are called nictinastic movement.

→ Light also influences daily movement of animals. Majority of animals are diurnal (active during the day) e.g.: Most of birds, man, butterflies etc.

→ Some animals, such as cockroaches, bats, owls, moths etc hide during the day, and become active at night. They are called nocturnal animals. Photoperiod also affects the breeding cycles of animals.

4. Soil:
→ The vegetation on the earth is the direct result of the nature of soil. Soil provides water, mineral ssalts and anchorage to plants. The characteristics of soil such as its constituents, origin, temperature range, water holding capacity, aeration, minerals etc., determine the flora and fauna of a particular place.

→ Parameters such as pH, mineral composition and topography determine the type of vegetation and animals of any area. Most organisms survive in an optional pH range. Plants and aquatic animals require acidic conditions and others need neutral or alkaline conditions.

2nd PUC Biology Notes Chapter 13 Organisms and Populations

Response to Abiotic Factors:
→ Many organisms have evolved (during the course of million years of their existence) a relatively constant internal environment (homeostasis), that allows all the biochemical reactions to proceed with maximum efficiency. They are called the regulators.
Their constancy could be in terms of optimal temperature, osmotic concentration of body fluids, etc.

→ Other organisms may be

  • partial regulators or
  • conformers.

→ Partial regulaters try and regulate their internal environment by physiological or behavioural means, but beyond a certain limit, they just conform to the external environmental conditions.

→ Conformers are those organisms, which change their body temperature or osmolarity of the body fluid according to the medium they inhabit; they do not have any internal mechanism to regulate and no energy is spent.

(a) Regulation: The organisms maintain homeostasis by physiological and/or behavioural means, and ensure a constant body temperature (thermoregulation), osmotic concentration,
(osmoregulation), etc.
2nd PUC Biology Notes Chapter 13 Organisms and Populations 2

→ The levels of thermal tolerance of the species determine their geographical distribution.

→ Evolutionary biologists believe that the success of mammals is mainly due to their ability to maintain a constant body temperature, that they are able to survive in Antarctica as well as in Sahara desert.

2nd PUC Biology Notes Chapter 13 Organisms and Populations

(b) Conformation:
→ Most of the animals and nearly all plants cannot maintain a constant internal environment.

→ Their body temperature changes with the ambient temperature.

→ The osmotic concentration of body fluids of aquatic animals changes with those of the ambient water or osmotic concentration and such animals are called osmoconformers.

→ Thermoregulation is an energy-expensive process where heat loss or gain is a function of surface area.

→ Smaller animals have a larger surface area compared to body volume and lose heat f very fast when the outside is cold. They have to spend more energy to produce the body heat through metabolism and hence small animals (shrews, humming bird, etc.) are not found in polar regions.

(c) Migration:
→ By this mechanism, the organisms can move away temporarily from the stressful conditions in the habitat to another habitat with hospitable conditions.

→ Birds undertake long distance migrations during winter, e.g., Keol Dev Ghana (Bharatpur) National Park hosts thousands of migratory birds from Siberia and other extremely cold northern regions.

(d) Suspension:
→Those organisms which cannot/do not migrate, suspend their metabolic functions during the stressful period and resume their functions at the return of the favourable condition, Hibernation (in frogs, certain reptiles and polar bears) and aestivation (some snails and fish) are examples of suspension.

→ Diapause is a stage of suspended development shown by certain zooplanktons of lakes and ponds under unfavourable conditions.

→ Adaptations: Any attribute of the organism (morphological, physiological or behavioural)
that enables the organism to survive and reproduce in its habitat is called adaptation.

→ Many adaptations have evolved over a long evolutionary time and are genetically controlled. The ultimate aim of all the adaptations is to make the individual fit to obtain food and space for its survival.

Some of the examples of adaptations are given below:
(a) In the absence of external water, the Kangaroo rat in North American deserts is capable of meeting all its water requirements through its internal fat oxidation, in which water is a by product.
Also it can concentrate its urine to a minimal volume.

(b) Mammals living in colder climates have shorter ears and limbs to minimize heat loss. This is called Allen’s Rule.

(c) Aquatic mammals like seals, living in polar seas have a thick layer of fat (Blubber) below their skin, that acts as an insulator and reduces loss of body heat.

(d) Fishes thriving in Antartic waters where the temperature is below zero degrees, have an array of biochemical adaptations to such extreme environments.

2nd PUC Biology Notes Chapter 13 Organisms and Populations

(e) Desert plants possess the following adaptations:

  • Thick cuticle on their leaf surface.
  • Posses sunken stomata.
  • They have a special photosynthetic pathway i.e., CAM pathway that enables their stomata to remain closed during day time.
  • In opuntia, the leaves are reduced to spines and the photosynthetic functions are taken over by the flattered stems.

(f) Archaebacteria have adaptations to survive at temperature more than 100°C.

(g) When human beings go from plains to high altitudes (> 3500 m) [eg : Rohtang pass] they experience altitude sickness, due to the low atmospheric pressure and non availability of oxygen. They develop symptoms like fatigue nausea and heart palpitations.
But gradually the body gets adjusted by increasing red blood cell production, decreasing binding capacity of haemoglobin and increasing the breathing rate.

Population:

All the individuals of a species occurring in a locality constitute a population.

Population attributes :
A population has certain attributes that an individual organism does riot. A population has group attributes like birth and death rates, sex ratio, age distribution, population size etc.

Birth and death rates:
In a population, birth and death rates refer to the per capita birth and death respectively. Therefore, these rates are expressed as change in numbers (increase or decrease) with respect to members of the population. Consider the following example to understand the birth and death rates.

(i) In a pond there were 20 lotus plants last year, and 8 new plants were added to the existing population. Thus, the current number of plants in the population is 28.
2nd PUC Biology Notes Chapter 13 Organisms and Populations 3

(ii) In a laboratory population of 40 fruit flies, 4 flies died during a specified time interval (say a week).
2nd PUC Biology Notes Chapter 13 Organisms and Populations 42nd PUC Biology Notes Chapter 13 Organisms and Populations 4

Sex Ratio:
Sex ratio is another attribute characteristic of a population. An individual belongs to either male or female sex, but a population has a sex ratio. For example, 60 per cent of the population are females and 40 percent males.

2nd PUC Biology Notes Chapter 13 Organisms and Populations

Age distribution:
A population at any given time is composed of individuals of different ages. Ecologically a population has three age groups-pre-reproductive, reproductive and post reproductive. Their comparative abundance determines the reproductive status of population. A population having larger number of young individuals will show rapid increase (positive growth). A population with almost equal number of various age groups show stable growth (zero growth). A population with large number of post-reproductive or older individuals and lesser number of pre- reproductive individuals will show declining population (negative growth).

If the age distribution (per cent individuals of a given age or age group) is plotted for the population, with pre-reproductive groups at the base, reproductive one in the middle and post- reproductive grouops at the top, the resulting structure is called an age pyramid. For human population, the age pyramids generally show age distribution of males and females in a combined diagram. The growing, stable and declining populations respectively show broad base, bell shaped and urn shaped pyramids.
2nd PUC Biology Notes Chapter 13 Organisms and Populations 5

Population size:
→ The size of a population may be the outcome of competition with another species, the impact of predator or the effect of a pesticide application. It tells a lot about its status in the habitat. Various ecological processes in a population, are evaluated in terms of change in the population size. The size of a population in nature could be as low as < 10 (e.g., Siberian cranes at Bharatpur wetlands in any year), or go into millions (e.g., Chlamydomonas in a pond). Population size, more technically called population density (designated as N) need not necessarily be measured in numbers only.

→ Although the total number is most appropriate measure of population density, still it is difficult to determine population density in some cases. For instance, if there are 200 Parthenium (carrot grass) plants in a forest area, but only a single huge banyan tree with a large canopy, indicating that the population density of banyan is low relative of that of Parthenium, amounting under estimation of the enormous role of the banyan tree in that community.

→ In such cases the per cent cover or biomass is a more meaningful measure of the population size. If the population is huge and counting is impossible or very time consuming, the total number is not easily measured . For a dense laboratory culture of bacteria, the number of colonies in the petri dish may be the best measure to report its density. Sometimes, for certain ecological investigations, there is no need to know the absolute population densities then, relative densities serve the purpose equally well.

→ For example, the number of fish caught per trap is good enough measure of its population density in the lake. Sometimes population size is indirectly estimated without actually counting them. The census in our national parks and tiger reserves is often evaluated on the basis of pug marks (animal’s foot print) and faecal pellets.

2nd PUC Biology Notes Chapter 13 Organisms and Populations

Population Growth:

The size of population of any species in not a static parameter. It keeps on changing with time, depending on various factors such as availability of food, predation pressure and prevailing weather. Such changes give some idea of what is happening to the population, whether it is increasing or decreasing. Though a number of factors affect population size, the density of a population in a given habitat during a given period, fluctuates due to four basic processes-natality, mortality, immigration and emigration.

The population density is the number of individuals of a species per unit area/space at a given time. Mathematically population density is expressed as:

D = \(\frac{\mathrm{N}}{\mathrm{S}}\)

where, D stands for the population density, N denotes the number of individuals of a species at- a specific time and S represents the number of units of the space.

1. Natality: It refers to the number of births during a given period in the population that are added to the initial density.

2. Mortality: It is the number of deaths in the population during a given period.

3. Immigration: It is the numbed of individuals of the same species that have come into the habitat from elsewhere during the time period under consideration.

4. Emigration and gone elsewhere during the time period under consideration. Natality and immigration contribute to an increase in population density, while mortality and emigration to a decrease.

Therefore, population growth or change in the size of population in a given time is determined by the above factors.
Change in population size = (Births + Immigration) – (Deaths + Emigration)
If N is the population density at time t, then its density at time t + 1 is
Nt + 1 = Nt + [(B + I) – (D + E)]
2nd PUC Biology Notes Chapter 13 Organisms and Populations 6

It is clear from the above equation, that population density increases if the number of births plus the number of immigrants (B +1) is more than the number of deaths plus the number of emigrants (D + E), otherwise it will decrease. Under normal conditions, births and deaths are the most important factors influencing population density. If a new habitat is just being colonized, than immigration may contribute more significantly to the population growth than birth rates.

2nd PUC Biology Notes Chapter 13 Organisms and Populations

Differences between Natality and Mortality

Natality  Mortality
1. It refers to the number of births per unit population per unit time e.g., per thousand. per year in humans. 1. It refers to the number of deaths per unit population per unit time, e.g., per thousand individuals per year in humans.
2. It adds new members to the population.  2. It removes individuals from the population.
3. It increases the size of population.  3. It decreases the size of population.
4. Natality adds to population density.  4. Mortality reduces density of population.
5. It maintains continuity of population.  4. Mortality reduces density of population.
6. It is high when population size is small and low when population size is large.  6. Mortality is low when population size is small and high when population size is large.

Differences between Immigration and Emigration

Immigration  Emigration
1. It refers to the inward movement of some individuals into a local population. 1. It is a permanent outward movement of some individual from a local population.
2. It is caused by the availability of better living conditions. 2. It is caused by the occurrence of deficiencies and calamities.
3. It results in an increase in the size of gene pool and local population. 3. It results in a decrease in the size of gene pool and local population.

Growth Models:

The growth of a population with time shows specific pattern that can be predicted. The uncontrolled human population growth and the problems created by it in our country is a matter of concern. It is, therefore, essential to be curious if different animal populations in nature behave the same way. Perhaps, we can learn from nature, how to control population growth.

1. Exponential Growth:
→ The availability of resources (food and space) is essential for the unimpeded growth of a population. When the food and space in the habitat are unlimited, each species has the ability to realize fully its inherited potential to grow, as observed by Darwin while developing his theory of natural selection. Then the population grows in an exponential or geometric ratio.

→ If in a population of size n, the birth rate (per capita births) is represented as b and death rates (per capita death) as d, the increase or decrease in n during a unit time period t will be \(\frac{d n}{d t}\) Here, r is called ‘intrinsic rate of natural increase’. It is a very important parameter selected for assessing impacts of any biotic or abiotic factor on population growth.

→ Following are some examples to give some idea about the magnitude of r values.

→ For the Norway rat the r is 0.015, and for the flour beetle it is 0.12. The r value for human population in India in the year 1981,was 0.0205. The current value of r can be calculated by knowing the birth rates and death rates.

→ The equation given above describes the exponential or geometric growth pattern and results in a J-shaped curve when we plot n in relation to time. By applying basic calculus, you can derive the integral form of the exponential growth equation as nt = n0en

→ where, nt = Population density after time t; n0 = Population density at time zero; r = intrinsic rate of natural increase; e = the base of natural logarithms (2.71828).
2nd PUC Biology Notes Chapter 13 Organisms and Populations 7

2nd PUC Biology Notes Chapter 13 Organisms and Populations

If any species is growing exponentially under unlimited resources, it can reach enormous population densities in a short time. Darwin showed how even a slow growing animal like elephant could reach unlimited numbers in the absence of checks.

2. Logistic Growth:
→ In nature, no population of any species gets unlimited resources to permit exponential growth. As a result, competition occurs between individuals for limited resources and only the fittest individual survives and reproduces. Many countries have also realized this fact and introduced various restraints with the view to limit human population growth. In nature, a given habitat has enough resources to support a maximum possible number, beyond which no further growth is possible. The maximum number of individuals of a population that can be sustained indefinitely in a given habitat represents its carrying capacity (K).

→ If a population is growing in a habitat with limited resources, shows initially a lag phase, followed by phases of acceleration and deceleration and finally reaches a constant level, when the population density reaches the carrying capacity. In such a case, if the population size (N) is plotted over time (t) a S-shaped or sigmoid curve is obtained. This type of population growth is called Verhulst Pearl Logistic Growth. It is described by the following equation,
dn/dt = rN\(\left(\frac{\mathrm{K}-\mathrm{N}}{\mathrm{K}}\right)\)
where,
N = Population density at a time t
r = Intrinsic rate of natural increase and
K = carrying capacity.
For most animal populations, the resources for growth are finite and become limiting sooner or later. The logistic growth model is considered to be a more realistic one.

Population Interaction:
In nature, no species can live in isolation. For any species there must be atleast one more species on which it can feed. Plants and animals show interdependence on each other. A plant species which makes its own food cannot survive alone, it needs soil microbes to break-down the organic matter so as the inorganic nutrients become available for reuse by the plant. Animals help in pollination and dispersal of fruits and seeds of plants.

Populations of different species often interact in various ways in their habitats.

Population interactions

Species A  Species B Name of interaction
+ + Mutualism
Competition
+ Predation
+ Parasitism
+ 0 Commensalism
0 Amensalism

Both the species benefit in mutualism and both lose in competition in their interactions with each other. In both parasitism and predation only one species benefits (parasite and predator respectively) and the interaction is detrimental to the other species (host and prey, respectively). The interaction where one species is benefitted and the other is neither benefitted nor harmed is called commensalism. In amensalism on the other hand one species is harmed whereas the other is unaffected.

2nd PUC Biology Notes Chapter 13 Organisms and Populations

1. Predation:
It is an interaction between members of two species in which membersof one species capture, kill and eat up, members of other species. The killer is called predator and the one getting killed is called prey. The predator cannot survive without the prey. They keep prey population under control. Without the predators, the prey species could multiply and produce high density and cause ecosystem instability. When any exotic species is introduced into a geographical area, they establish and spread fast because the invaded land does not have its natural predators. When prickly pear cactus (Opuntia) was introduced in Australia in early 1920’s, it started multiplying and spreadihg rapidly into millions of hectares of rangeland. But, it was controlled, only after a cactus-feeding predator (cochineal insect) introduced from its natural habitat.

→ Predators may increase the biodiversity of communities by preventing a single species from becoming dominant. Such predators are called Keystone species and may have a profound influence on the balance of organisms in a particular ecosystem.

→ When a predator is too efficient and over-exploits its prey, then the prey becomes extinct and following that, the predator also becomes extinct for lack of food. That is why the predators in nature are ‘prudent’.

→ For plants, herbivores are the predators. Nearly 25 per cent of all insects are known to be phytophagous (feeding on plant sap and other parts of plants). Since plants are stationary, they have evolved different morphological and chemical defences against herbivores, e.g., thorns in Acacia, Cactus and production of posionous chemicals in Calotropis. When herbivores eat such plant they feel sick. That is why, cattle or goats never browse on these plants.

2. Competition:
→ Competition is defined as ‘an interaction that occurs between two or more organisms when the resources necessary for them are limited and adversely affect them. Gause’s Competition Exclusion Principle, states that two closely related species competing for the same resources cannot co-exist independently and competitively and the inferior one will get eliminated eventually, e.g. When two species of Paramecium i.e, Paramecium caudatum and Paramecium aurelia are kept together in one habitat for long time, it was observed that one species got eliminated.

→ The abingdon tortoise in Galapagos Islands became extinct within a decade after goats were introduced on the island, apparently due to the greater browsing efficiency of the goats. The larger and competitively superior barnacle Balanus dominates the intertidal area, and excludes the smaller barnacle Chathamalus from that zone. In general, herbivores and plants appear to be more adversely affected by competition than carnivores.

3. Parasitism:
→ It is an interaction or relationship between two living organisms of different species in which one species (usually smaller) called parasite obtains its food directly from another living organism (usually larger) called host. The parasite spends a part or whole of its life on or in the body of the host. Many parasites are host specific (they can parasitise only a single species of host) where the host and the parasite tend to co-evolve, that is, if the host evolves special mechanisms for rejecting or resisting the parasite, the parasite has to evolve mechanisms to counteract and neutralize them, in order to be successful with the same host species.

→ Parasites evolved special adaptations such as the loss of unnecessary sense organs, presence of adhesive organs or suckers to cling on to the host, loss of digestive system and high reproductive capacity. The life cycles of parasites are often complex, involving one or two intermediate hosts or vectors to facilitate parasitization of its primary host.

→ The parasites may be of the following types as listed below.

→ Ectoparasites are found on the outer, surface of host’s body e.g., head lice and humans, ticks on the skin of dogs, bed bugs etc.

→ Endoparasites are those that live inside the host body at different sites (liver, kidney, intestine, lungs, red blood cells etc.) The life cycle of endoparasite is more complex because of their extreme specialization, e.g., Malarial parasite in RBG of man, Ascaris and Taenia in the gut of man etc.

→ Brood parasitism in birds is a fascinating example of parasitism in which the parasitic bird lays its eggs in the nest of its host and lets the host incubate them. During the course of evolution, the eggs of the parasitic bird have evolved to resemble the host’s egg in size and colour to reduce the chances of the host bird detecting the foreign eggs and ejecting them from the nest.
Eg : Cuckoo lays eggs in the nest of crow.

2nd PUC Biology Notes Chapter 13 Organisms and Populations

4. Mutualism or symbiosis:
→ In which both the species are mutually benefited but association is obligatoiy and they cannot live separately under normal conditions.

→ e.g., mycorrhizae with association of fungus (e.g., Boletus) and roots of higher plants. The fungi help the plant in the absorption of water and essential nutrients from the soil while the plant in turn provides the fungi with carbohydrates.

→ Lichens represent an intimate mutualistic relationship between a fungus and photosynthesising algae or cyanobacteria.

→ Root nodules of legume plants, Casuarina, Alnus and leaf nodules of Ardisia have symbiotic association of nitrogen fixing bacteria – Rhizobium. The plants provide food and shelter to the bacteria and the bacteria fix free atmospheric nitrogen to the plant.

→ The most interesting example of mutualism are found in plant-animal relationships. Plants take the help of animals for pollinating their flowers and dispersing their seeds. Animals get rewards or fees in the form of pollen and nectar (for pollinators) and juicy and nutritious fruits (for seed dispersals).

→ In many species of fig trees, there is a tight one-to-one relationship with the pollinator species of wasp. The female wasp uses the fruit not only as an oviposition (egg laying) site but uses the developing seeds within the fruit for nourishing its larvae. The wasp pollinates the fig inflorescence while searching for suitable egg laying sites.

→ In return for the favour of pollination, the fig offers the wasp some of its developing seeds as food for the developing wasp larvae. The Mediterranean orchid orchid ophrys employs sexual deceit to get pollination done by a species of bee. One petal of its flower bears an uncarry resemblance to the female of the bee in size, colour and markings.

→ The male bee is attracted to what is perceives as a female, ‘pseudo copulates’ with the flower and during that process is dusted with pollan from the flower. When this same bee pseudocopulates with another flower, it transfer pollen to it and thus pollinates the flower.

2nd PUC Biology Notes Chapter 13 Organisms and Populations

5. Commensalism:
→ This is the interaction in which one species benefits and the other is neither harmed nor benefited.

→ Example: An orchid growing as an epiphyte on a mango branch, and barnacles growing on the back of a whale benefit, while neither the mango tree nor the whale derives any apparent benefit.

→ Another example of commensalfsm is the interaction between sea anemone that has stinging tentacles and the clown fish that lives among them. The fish gets protection from predators which stay away from the stinging tentacles. The anemone does not appear to derive any benefit by hosting the clown fish.

2nd PUC Biology Notes

2nd PUC Biology Notes Chapter 12 Biotechnology and its Applications

Karnataka 2nd PUC Biology Notes Chapter 12 Biotechnology and its Applications

Scope for Biotechnology

Biotechnology is having a wide scope in different fields such as Medicine, Industry, Agriculture, Animal husbandry, Aquaculture, Floriculture etc.
The significance of biotechnology in different fields is as follows.

2nd PUC Biology Notes Chapter 12 Biotechnology and its Applications

Biotechnological applications in medicine:

1. Gene therapy:
The technique of curing genetic diseases by replacing the defective genes by normal genes is called gene therapy W.F. Anderson is regarded as the father of gene therapy.

Types of gene therapy:
There are two main types of gene therapy, namely somatic cell gene therapy and germ line gene therapy.

(a) Somatic cell gene therapy: It is the replacement of the defective gene by a normal gene in somatic cells of the body. This therapy helps for treating the defective organs or tissues parts such as blood cells, liver cells, skin cells, lung cells etc. The genetic defects can be rectified only in that individual. The replaced gene is not transmitted to the next generation: The diseases like SCID [Severe combined immuno deficiency], Cystic fibrosis, Haemophilia, Cancer etc can be cured by somatic cell gene therapy.

Note: The first gene therapy experiment involved extraction of T-lymphocytes from the bone marrow of SCID patient. A healthy copy of ADA gene is introduced into these cells with the help of retrovirus as vector. These engineered cells are then injected into the bone marrow of the patient where those cells multiply. The altered cells would produce enough adenosine deaminase to relieve the disease symptoms. The lymphocytes have definite life span, the disease cannot be cured permanently. Repeated injections of modified lympheytes about three months for the patient are needed to control the disease.

(b) Germ line gene therapy: It is the replacement of the defective genes by normal genes in germ cells to rectify the genetic disorders. This includes gene therapy in sperms, eggs, zygotes or early embryos. Any change made in the germ cells by gene therapy will be transmitted to the offspring.

Methods of gene transfer :
There are two methods of gene tranfer namely viral vector method and non-viral vector method.

(a) Viral vector method [or ex vivo method]: In this method, retroviruses are employed as they have reverse transcriptase enzyme. In this process, normal genes are inserted into retrovirus and then such viruses are mixed with the target cells but outside the body. Here the desired gene is transferred to the chromosomes. These cells are then introduced into the patient where the desired genes multiply and produce the desired products, e.g.: SCID is cured by injecting a gene that produce ADA [Adenosine deaminase]

(b) Non viral methods [or in vivo method]: In this method the normal genes are directly delivered to target cejls but inside the body, e.g., Cystic fibrosis.

2nd PUC Biology Notes Chapter 12 Biotechnology and its Applications

Applications of gene therapy.

  • The genes causing genetic disease can be removed and normal genes can be inserted.
  • Non-functional organs can be made functional.
  • Severe combined immuno deficiency [SCID] disease can be cured by introducing normal Adenosine deaminase gene.
  • Cystic fibrosis, haemophilia can be cured by CFTR. [Cystic fibrosis transmembrane regulator], and factor 1% genes respectively.

2. Genetically engineered Insulin:
The hybrid DNA formed by the union of desired DNA [gene] and plasmid DNA is called recombinant DNA or Chimeric DNA or Mosaic DNA. The technique involved in the production of rDNA is called recombinant DNA technology.

Artificial synthesis of human insulin:
The process of synthesis of human insulin through recombinant DNA technology involves the following steps.

  1. Isolation of insulin gene [or desired gene].
  2. Insertion of insulin gene in to plasmid.
  3. Transfer of recombinant plasmid to Ecoli cell.
  4. Selection or isolation and culture of Ecoli cells having r-DNA.
  5. Extraction of human insulin.

2nd PUC Biology Notes Chapter 12 Biotechnology and its Applications 1

2nd PUC Biology Notes Chapter 12 Biotechnology and its Applications

1. Obtaining the insulin gene: The human insulin gene can be obtained by collecting the mRNA for insulin protein from P cells of islets of Langerhans of pancreas. From this mRNA, complementary DNA [C-DNA] is synthesized by using reverse .transcriptase or RNA dependant DNA polymerase enzyme.

2. Insertion of insulin gene into plasmid to produce rDNA: The plasmid pBR 322 is taken and is cut with the help of restriction endonuclease [Hind HI], Now insulin gene or cDNA for insulin is inserted by the side of P galactosidase gene. The ends are joined by using DNA plasmid called recombinant plasmid or recombinant DNA.

3. Transfer of r-DNA or r plasmid into E.coli cells: A culture of E.coli cells are taken and mixed with r-DNAs or r-plasmids having gene, and the mixture is treated with cold calcium chloride [CaC12], After sometime, the temperature of the solution is suddenly raised to 42°C This makes the plasma membrane of the host cell more permeable. This results in the easy entry of r-DNA into the E.coli cells.

4. Selection or isolation and culture of E.coli cells having r-DNA:E.coli cells that have received r-DNA for insulin are isolated from the mixture by using the specific antibiotic in the media. Those E.coli cells that have received r-DNA will survive as the resistance gene REN and the desired gene is inserted in this place. Such cells DNA are selected with r-DNA by using replica plating technique. These selected E.coli cells are then cultured in bioreactors for large scale production. These cells produce insulin hormone in large quantities.

5. Extraction of insulin: The insulin synthesised in recembinant E.coli cells is human insulin. It contains B-galactosidase removed by treating with cyanogen bromide to form proinsulin. This proinsulin contains 3 chains designated as ‘A’ ‘B’ and ‘C’ chains. This proinsulin is inactive due to the ‘C’ chain which connects ‘A’ chain [21 aa] and ‘B’ chain [30aa], Chain ‘C’ is cut off by treating the proinsulin with trypsin. This process results in the formation of active human insulin or Humulin.

Application of biotechnology in Agriculture:

→ Agricultural practice is of three types :

  • Agrochemical-based agriculture.
  • Organic agriculture and
  • Genetically engineered crop-based agriculture.

→ The use of genetically modified plants has been useful in the following ways:

  • Genetic modification has made the crops more tolerant to abiotic stresses like cold, heat, drought, salinity etc.
  • Post – harvest losses are much reduced.
  • Food produced from GM (Genetically modified) crops has enchanced nutritional value and taste.
  • As.the plants have increased efficiency of mineral usage by plants, the early exhaustion of fertility of soil is prevented.

2nd PUC Biology Notes Chapter 12 Biotechnology and its Applications

Production of pest – Resistant plants:

(a) Bt cotton:
→ Bacillus thuringiensis produces crystal proteins called Cry proteins which are toxic to larvae of insects like tobacco bud worm, army worm, beetles and mosquitoes.

→ Cry proteins exist as inactive protoxins and get converted into active toxin when ingested by the insect, as the alkaline pH of the gut solubilises the crystals.

→ The activated toxin binds to the surface of epithelial cells of midgut and creates pores.

→ This causes swelling and lysis of cells leading to the death of the insect (larva).

→ The genes (cry genes) encoding this protein are isolated from the bacterium and incorporated into several crop plants like cotton, tomato, com, rice, soybean, etc.

→ The proteins encoded by the following cry genes control the corresponding pests.

  • Cry I AC and Cry II Ab control cotton bollworms.
  • Cry I Ab controls com borer.
  • Cry III Ab controls colarado potato beetle.
  • Cry III Bb controls com rootworm.

(b) Protection Against Nematodes:
→ A nematode called Meloidegyne incognitia infects plants and reduces their yield.

→ The specific genes (in the form of cDNA) from the parasite are introduced into the plant using Agrobacterium as the vector.

→ The genes are introduced in such a way that both sense/coding RNA and antisense RNA (complementary to the sense/coding RNA) are produced.

→ Since these two RNAs are complementary, they form a double stranded RNA (ds RNA).

→ This silences the specific RNA of the nematode, by a process called RNA-interference. It prevents the translation of a specific mRNA (silencing).

→ As a result, the parasite cannot live in the transgenic host and the transgenic plant is protected from the pest.

2nd PUC Biology Notes Chapter 12 Biotechnology and its Applications

Molecular Diagnosis:

→ Effective treatment of diseases require early diagnosis and understanding of their pathophysiology.

→ Early diagnosis of diseases is not possible by conventional techniques like serum and urine. analysis, sputum and stool analysis etc.

→ Modern techniques like rDNA, PCR, ELISA and RIA are used for early diagnosis.

  • Infection of pathogens (viruses, bacteria etc) is suspected only when they produce disease symptoms.
  • By this time the pathogens have multiplied in the body.
  • But by PCR, amplification of nucleotide is possible and thus it is possible to detect bacteria virus even at very low concentrations.
    e.g.: HIV detection, genetic disorders

→ Modern techniques can also help in the identification of mutated genes in humans.

  • A single stranded DNA or RNA, tagged with a radioactive probe is allowed to hybridise with its complementary DNA in a clone of cells, followed by detection by using autoradiography.
  • The clone having mutated gene will not appear in the photographic film because the probe will not have complementary nitrogen base with the mutated gene.
  • In ELISA test the infection of pathogen (viruses, bacteria, fungi, mycoplasm like organism) can detect the antibodies synthesised against the pathogen.

Transgenic animals:

An animal developed by introducing the desired foreign gene is called a Transgenic animal. Transgenic animals can be produced by the following methods.

→ Microinjection of desired genes into pronucleus of the fertilized egg.

→ Retroviral infection of fertilised eggs at 4 to 8 celled stages.

→ Genetic alterations of embryonic stem cells [ESC] and their reintroduction into the blastocyst.
Transgenic animals are useful in biological, biomedical and biotechnological researches especially in animal husbandary, dairy and pharmaceutical industries.

Note: Transgenic animals are used as bioreactors for mass production of drugs and proteins. It is called genefarming or molecular farming.
e.g.:
2nd PUC Biology Notes Chapter 12 Biotechnology and its Applications 2

2nd PUC Biology Notes Chapter 12 Biotechnology and its Applications

Benefits of transgenic animals:

1. Normal physiology and development: Transgenic animals can be specifically designed to allow the study of how genes are regulated, and how they affect the normal functions of the body and its development.

2. Study of disease: Many transgenic animals are designed to increase our understanding of how genes contribute to the development of disease, e.g.: Cancer, cystic fibrosis, rheumatoid arthritis and Alzheimer’s.

3. Biological products: Medicines required to treat certain human diseases are the biological products. But such useful biological products can be created by the introduction of the portion of DNA (or genes) into an animal which codes for a particular transgenic product.

4. Vaccine safety: Safety of vaccines must be confirmed before they are administered, e.g: Transgenic mice are being used to test the safety of the polio vaccine.

5. Chemical safety testing: This is known as toxicity / safety testing. The procedure is the same as that used for testing toxicity of drugs. Transgenic animals are made to carry genes which make them more sensitive to toxic substances than non-transgenic animals. They are then exposed to the toxic substances and the effects studied.

Ethical issues:

→ The manipulation of living organisms by the human race cannot go on unchecked, without regulation. Some ethical standards are required to evaluate the morality of all human activities, that might help or harm living organisms.

→ The Indian Government has set up organisations which are authorised to take decisions regarding the validity of genetic modifications and the safety of introducing genetically modified organisms for public services.

One such organisation is the Genetic Engineering Approval Committee (GEAC).

Bio patent:
It is an official right or approal from a government agency granting an inventor or establishment the sole monopoly to use or exploit for commercial benefits. The argument in favor of granting such bio patents was to stimulate research and economic growth. However, there are serious objections to such bio patents on ethical, political and scientific basis. Example: A patent has been granted for producing “all transgenic plants of brassica family”. Such broad patents provide monopoly control in the hands of a few multi nationals which could pose a great threat to global food security.

2nd PUC Biology Notes Chapter 12 Biotechnology and its Applications

Biopiracy:
It is a term used to refer to the use of bio-resources by multinational companies and other organisations without proper authorisation from the countries and people concerned without compensatory payment.

e.g.: Basmati rice grown in India is distinct for its unique flavour and aroma, but an American company got patent rights on Basmati through the US patent and trademark office. The new variety of Basmati has been developed by this company by crossing an Indian variety with the semi-dwarf varieties.

2nd PUC Biology Notes